IC Markets





































China's Economy Grew 4.5% in the Third Quarter as Exports Surged and Investment Fell
Growth picked up from 4.3% in the spring, but shoppers stayed cautious and investment kept shrinking, a split that matters for the Australian dollar.
 WriterAbir KhanWriterWrites the guides · checks every figure against primary sources View profileAbout Abir →

 Market analysisTanbir Habib RiyadForex & Crypto AnalystForex and crypto analyst · technical and fundamental analysis View profileAbout Tanbir →

 Fact-checking & riskJannatul FerdaushFact-Checker & Risk AnalystFact-checks every figure · risk analysis · Applied Statistics, University of Dhaka View profileAbout Jannatul →

 Trading reviewJowel RanaCo-Founder & Forex TraderCo-founder · forex trader · reviews guides from a trader's view View profileAbout Jowel →

 Final approvalRanjan NiskrityFounder, Owner & Forex TraderFounder and owner · forex trader · signs off every guide View profileAbout Ranjan →

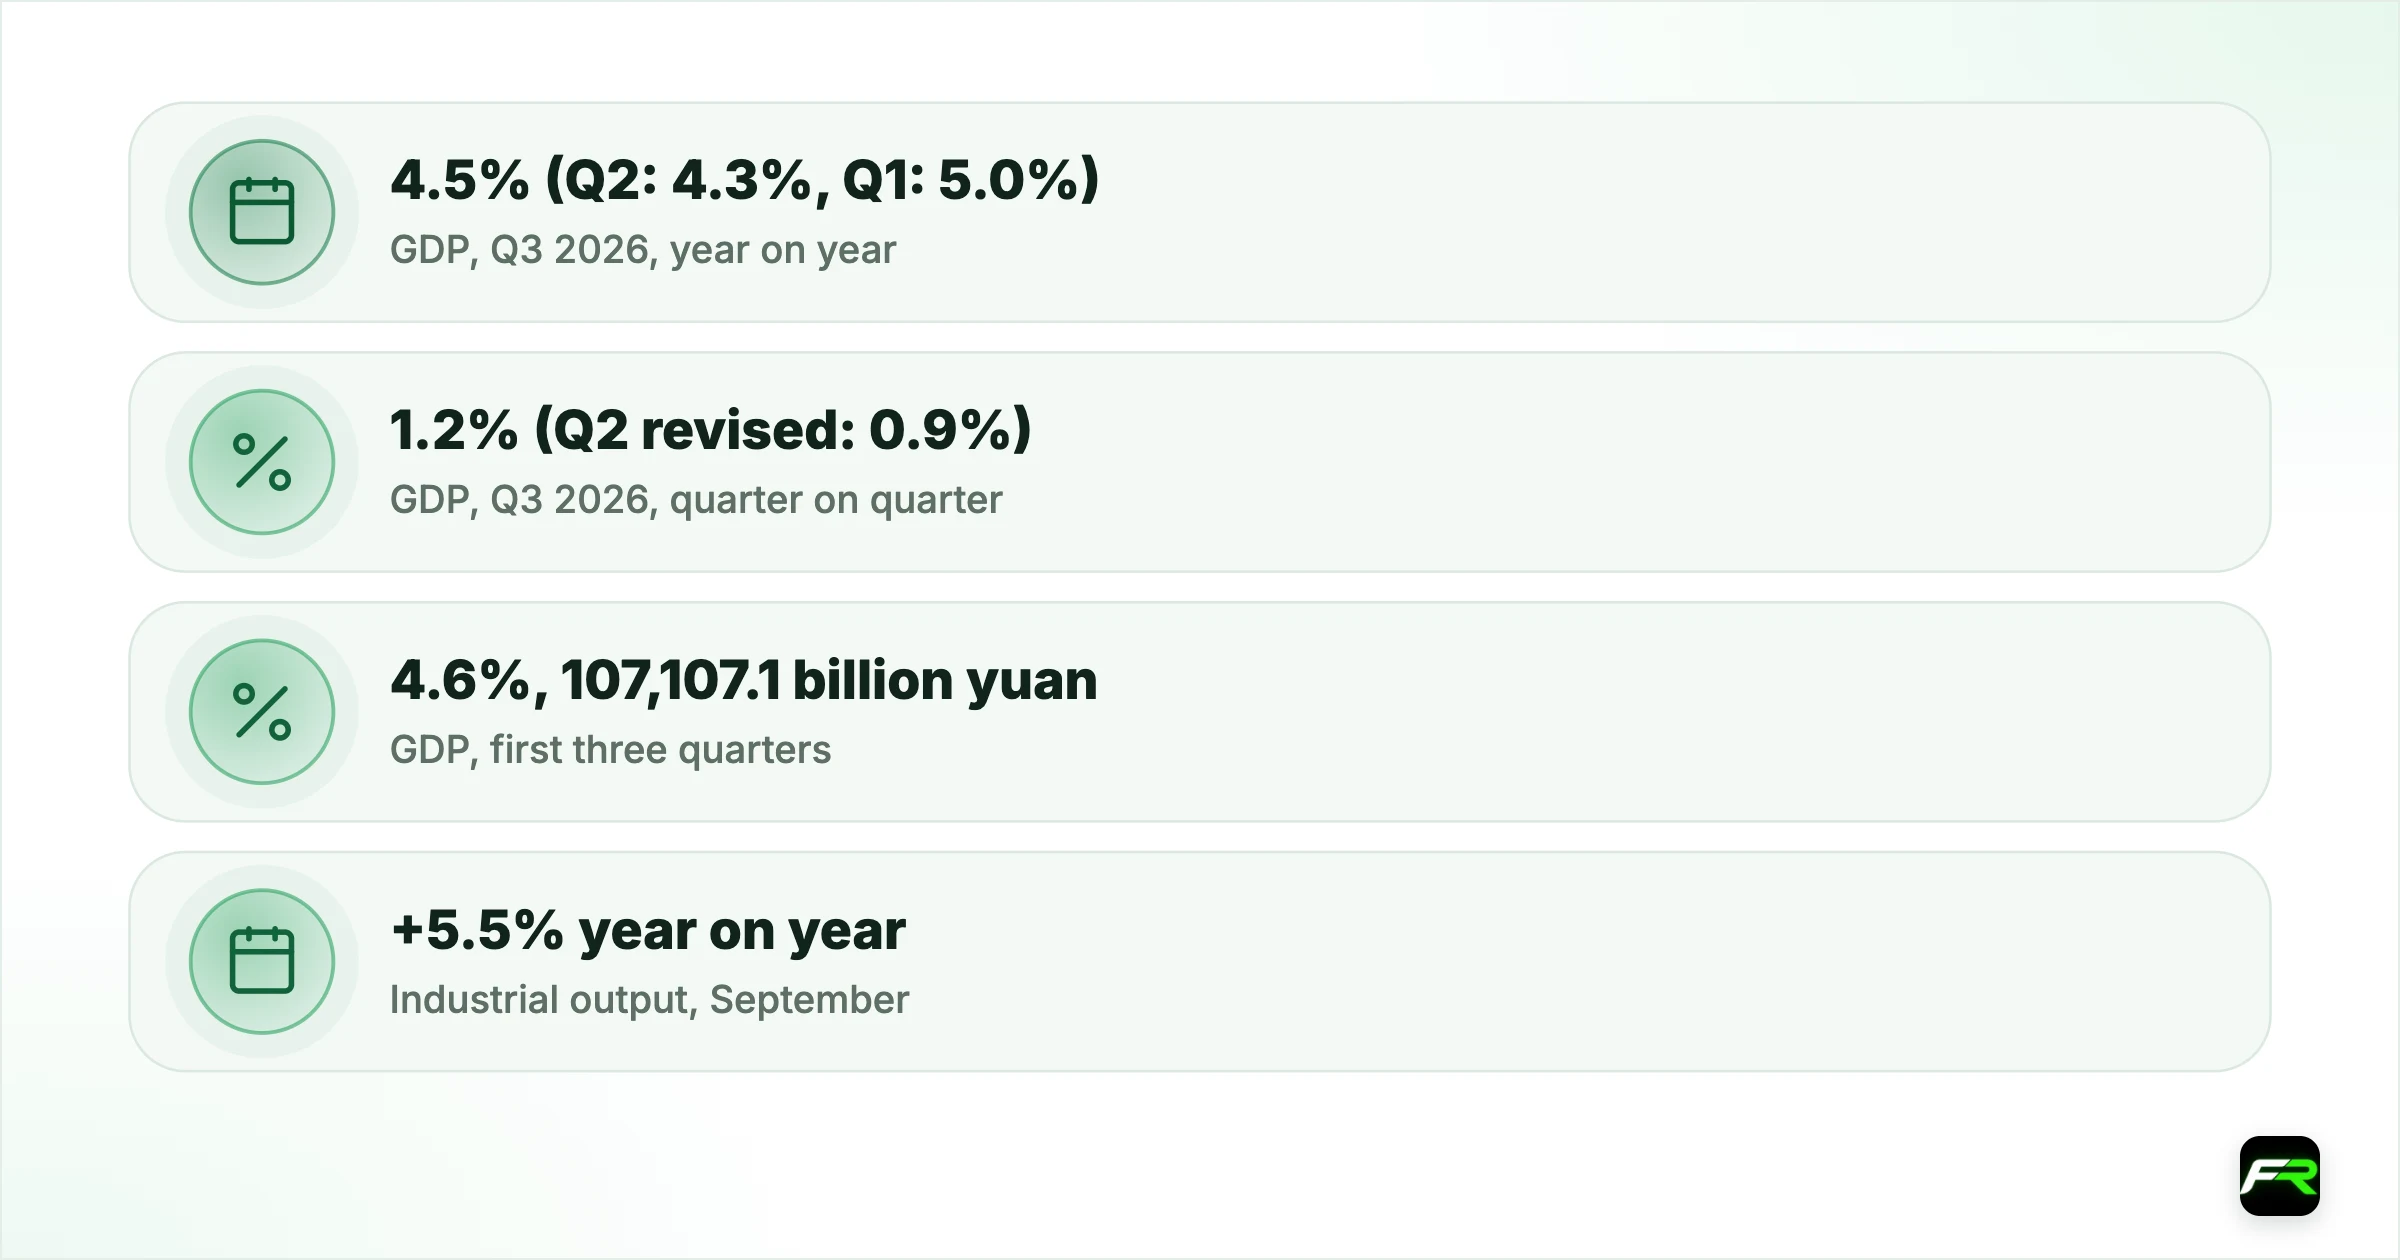
China's economy grew 4.5% in the third quarter from a year earlier, a little faster than the 4.3% recorded in the second quarter. The National Bureau of Statistics published the figure at 10:00 Beijing time on Monday 19 October, which was 02:00 UTC, early in the Asian session. Compared with the April to June period, output rose 1.2% after seasonal adjustment, up from a revised 0.9%.
Behind the headline sits an economy pulling in two directions. Exports and factory output are running hot, helped by strong demand for equipment and high-tech goods. Household spending is barely growing, and investment in buildings, roads and factories is still falling, dragged down by a deep fall in property investment. The statistics bureau itself said the problem of “insufficient domestic demand remains prominent”.
For currency traders, Chinese growth is rarely a story about the yuan alone. The Australian and New Zealand dollars tend to react to it, because China buys a large share of what both countries export. On Monday the reaction was small: AUD/USD rose from about 0.6971 to 0.6978 in the hour after the release and was trading near 0.6977 at 03:04 UTC, up from Friday's close of 0.6949.
| GDP, Q3 2026, year on year | 4.5% (Q2: 4.3%, Q1: 5.0%) |
|---|---|
| GDP, Q3 2026, quarter on quarter | 1.2% (Q2 revised: 0.9%) |
| GDP, first three quarters | 4.6%, 107,107.1 billion yuan |
| Industrial output, September | +5.5% year on year |
| Retail sales of consumer goods, September | +1.1% year on year |
| Fixed-asset investment, January to September | −7.2% year on year |
| Real estate investment, January to September | −20.6% year on year |
| Urban surveyed unemployment, September | 5.2% |
What the third-quarter numbers show
Over the first nine months of 2026, gross domestic product reached 107,107.1 billion yuan, up 4.6% at constant prices. That is a touch below the 4.7% pace of the first half, because the second quarter was weaker than the first. By quarter, growth ran at 5.0%, 4.3% and 4.5%, so the summer dip has partly reversed without a return to the pace seen at the start of the year.
Services carried the economy again. Value added in the tertiary sector grew 5.2% in the first three quarters, against 3.8% for industry and construction combined and 3.7% for farming. Leasing and business services grew 12.3% and information technology services 10.4%, while finance grew 5.8%. Those are the parts of the economy least exposed to the housing slump.
September itself was firmer than August on most measures. Industrial output rose 5.5% from a year earlier, 0.3 points faster than in August. The services production index climbed 4.8%, up 0.7 points. Retail sales of consumer goods grew 1.1%, a pick-up from August's 0.4% but still weak by China's own standards. Urban unemployment eased to 5.2% from 5.3%.
Quarterly growth figures are revised as new data arrive. The bureau's note shows the second quarter's quarter-on-quarter rate at 0.9% and the first quarter's at 1.3%. A 1.2% rise in the third quarter therefore marks a clear rebound in momentum, even if the year-on-year rate only moved up by 0.2 points.
| Quarter | Year on year | Quarter on quarter |
|---|---|---|
| Q1 2026 | 5.0% | 1.3% |
| Q2 2026 | 4.3% | 0.9% |
| Q3 2026 | 4.5% | 1.2% |
Source: National Bureau of Statistics of China, 19 October 2026. Quarter-on-quarter rates are seasonally adjusted and include the bureau's latest revisions.
Exports and factories set the pace
Foreign trade was the strongest part of the report. In yuan terms, exports rose 16.4% in the first three quarters and imports 22.3%, according to customs data quoted by the bureau. September alone was stronger still: exports jumped 29.6% from a year earlier and imports 24.6%. Shipments of mechanical and electrical products, which include machinery, electronics and vehicles, grew 23.7% and made up 64.3% of all exports.
Factory data tell the same story. Equipment manufacturing grew 10.2% over the nine months and high-tech manufacturing 14.3%, far ahead of industry as a whole at 5.3%. Output of industrial robots rose 29.1%, lithium-ion batteries 39.5% and 3D printing devices 62.5%. The manufacturing purchasing managers' index stood at 50.1 in September, just above the 50 line that separates growth from contraction.
Prices are moving too. Producer prices for industrial goods rose 5.0% from a year earlier in September, 1.2 points faster than in August, and the prices factories pay for inputs climbed 6.9%. Consumer prices, by contrast, rose only 0.9%, with core inflation at 1.0%. Rising factory-gate prices in China feed into the cost of goods sold abroad, which matters for inflation in its trading partners at a time when central banks from Washington to Canberra are already worried about energy costs.
Weak spots: shoppers, property and private investment
Household demand remains soft. Total retail sales of goods and services rose 2.6% in the first three quarters, with goods up 1.0% and services up 5.0%, while retail sales of consumer goods, the older measure, grew just 1.1%. Online sales of goods and services gained 4.4%. Per-person disposable income rose 4.4% in real terms, so incomes are growing faster than spending on goods.
Investment is shrinking. Fixed-asset investment fell 7.2% from a year earlier in the nine months, the same decline as in the first eight months. Real estate development investment dropped 20.6%, and sales of new commercial buildings fell 13.9% by value. Excluding property, investment was still down 4.2%. Private investment fell 10.4%, a sign that business owners remain cautious about the outlook.
There is a small bright spot. Investment in intellectual property products, such as software, databases and research, grew 9.3%, and spending on information services jumped 20.2%. Fixed-asset investment also rose 0.07% in September from August, a tiny gain, but the first monthly rise since February on the bureau's revised series.
That mix explains the bureau's careful language. It said the economy showed “strong resilience and vitality”, then warned that the international environment is “complex and volatile” and that the foundation for steady growth “still needs to be consolidated”. More effective macro policies and stronger efforts to boost domestic demand were its prescription, though no specific measures were named.
Why the Australian and New Zealand dollars care
Australia ships iron ore, coal and gas to China, and New Zealand sells it dairy, meat and timber. Faster Chinese growth tends to support demand and prices for those goods, which in turn supports the two currencies. The details of this report point in different directions for each.
For Australia, the drop in property investment is the worry. Steel demand depends heavily on Chinese construction, and a 20.6% fall in real estate investment does not help iron ore. Strong manufacturing and fast-growing investment in technology can soak up some of the slack. The Reserve Bank of Australia raised its cash rate to 4.60% on 29 September and decides again on 3 November. Our story on Australia's September jobs fall covers the local side of that decision.
For New Zealand, Chinese consumers matter more than Chinese builders, so the weak retail figure is the number to watch. NZD/USD traded near 0.5657 at 03:04 UTC, almost unchanged on the release after a strong Friday. The Reserve Bank of New Zealand announces its next decision on 28 October, a week after Stats NZ publishes third-quarter consumer prices on Thursday 22 October.
China's own currency barely moved. USD/CNY traded between about 6.670 and 6.683 through the morning, close to Friday's level. China manages its currency within a band around a daily fixing set by the central bank, so data surprises tend to show up more in the Australian dollar, Asian stock markets and commodity prices than in the yuan.
What it means for traders
A report with this many moving parts is easy to over-read. These points can help keep it in proportion.
- Read the quarter-on-quarter figure as well as the annual one. A 1.2% rise after 0.9% says momentum improved more than the move from 4.3% to 4.5% suggests.
- Separate exports from domestic demand. Strong trade supports Chinese industry, while weak retail and property figures keep pressure on policymakers to act.
- Trade the reaction through AUD/USD and NZD/USD rather than the yuan, and remember that Australian data and the RBA's 3 November decision will matter more for the Aussie over the next two weeks.
- Watch for policy news. The bureau asked for more effective macro policies; any announcement of fresh support would be a separate market event.
- Keep risk small in thin Asian trading. Spreads on AUD and NZD pairs can widen around Chinese releases, especially before Sydney and Tokyo are fully open.
Say you buy AUD/USD at 0.6977 on the view that China's rebound supports the Aussie, with a stop at 0.6937, 40 pips below. A mini lot of 10,000 units is worth about $1 a pip, so the stop risks about $40 per mini lot. On a $5,000 account with a 1% limit of $50, one mini lot fits with a little room for spread. If the RBA or Australian data turn against you before 3 November, cut the trade rather than move the stop.
Check session times on our forex market hours page and the week's releases on the economic calendar. The IMF's view on global growth, set out at its Annual Meetings, is in our IMF story. Size each trade with the position size calculator.
Data releases from China can move commodity currencies sharply and with little warning. Leverage magnifies losses as well as gains, so trade only with money you can afford to lose.
All economic figures are from the National Bureau of Statistics of China's release of 19 October 2026, including customs and housing data the bureau quotes. Growth rates are real; trade, retail and investment rates are nominal unless stated. Central bank rates and dates are from the Reserve Bank of Australia and the Reserve Bank of New Zealand. Currency levels are market data built from hourly bars to 03:04 UTC on 19 October and differ slightly between providers. Comments on currency effects are FX Recap's own reading. This is news, not investment advice.
Frequently asked
What was China's GDP growth in the third quarter of 2026?
China's GDP grew 4.5% from a year earlier in the third quarter of 2026, up from 4.3% in the second quarter, according to the National Bureau of Statistics. Compared with the previous quarter, output rose 1.2% after seasonal adjustment.
How fast has China grown in 2026 so far?
Gross domestic product rose 4.6% in the first three quarters of 2026, to 107,107.1 billion yuan. Growth was 5.0% in the first quarter, 4.3% in the second and 4.5% in the third.
Why does China's GDP affect the Australian dollar?
China is a major buyer of Australian exports such as iron ore, coal and gas. Stronger Chinese growth tends to lift demand and prices for those goods, which supports the Australian dollar, while a slowdown, especially in construction, tends to weigh on it.
What were China's weakest numbers in the report?
Fixed-asset investment fell 7.2% in January to September, real estate investment dropped 20.6% and retail sales of consumer goods grew just 1.1%. The statistics bureau said insufficient domestic demand remains a prominent problem.
Sources: National Bureau of Statistics of China: National economy in the first three quarters of 2026 (19 October 2026) · National Bureau of Statistics of China: Consumer Price Index, September 2026 · National Bureau of Statistics of China: 2026 release calendar · Reserve Bank of Australia: cash rate target
The team behind this guide
Researched, checked and approved by five forex specialists
Every guide is written, fact-checked and edited before it goes live, and updated when the facts change. Spotted an error? Tell us.