IC Markets

 3:09
 2:39
 2:10
 2:18
 3:43
 8:42




































China Inflation Data Due Monday: Factory Prices Up 5.0% Meet a Softer October PMI as AUD/USD Sits at a 60-Day Low
Producer prices jumped in September while consumer inflation stayed under 1%. October's figures land at 01:30 UTC, with the Aussie already under pressure.
 WriterAbir KhanWriterWrites the guides · checks every figure against primary sources View profileAbout Abir →

 Market analysisTanbir Habib RiyadForex & Crypto AnalystForex and crypto analyst · technical and fundamental analysis View profileAbout Tanbir →

 Fact-checking & riskJannatul FerdaushFact-Checker & Risk AnalystFact-checks every figure · risk analysis · Applied Statistics, University of Dhaka View profileAbout Jannatul →

 Trading reviewJowel RanaForex TraderForex trader · reviews guides from a trader's view View profileAbout Jowel →

 Final approvalRanjan N. MondolForex TraderForex trader · signs off every guide View profileAbout Ranjan →

China publishes its consumer and producer price figures for October on Monday 9 November at 09:30 Beijing time, which is 01:30 UTC, according to the National Bureau of Statistics release calendar. They will be the first major numbers of the week and arrive while most of Europe is still asleep, so the Australian dollar is likely to take the first reaction.
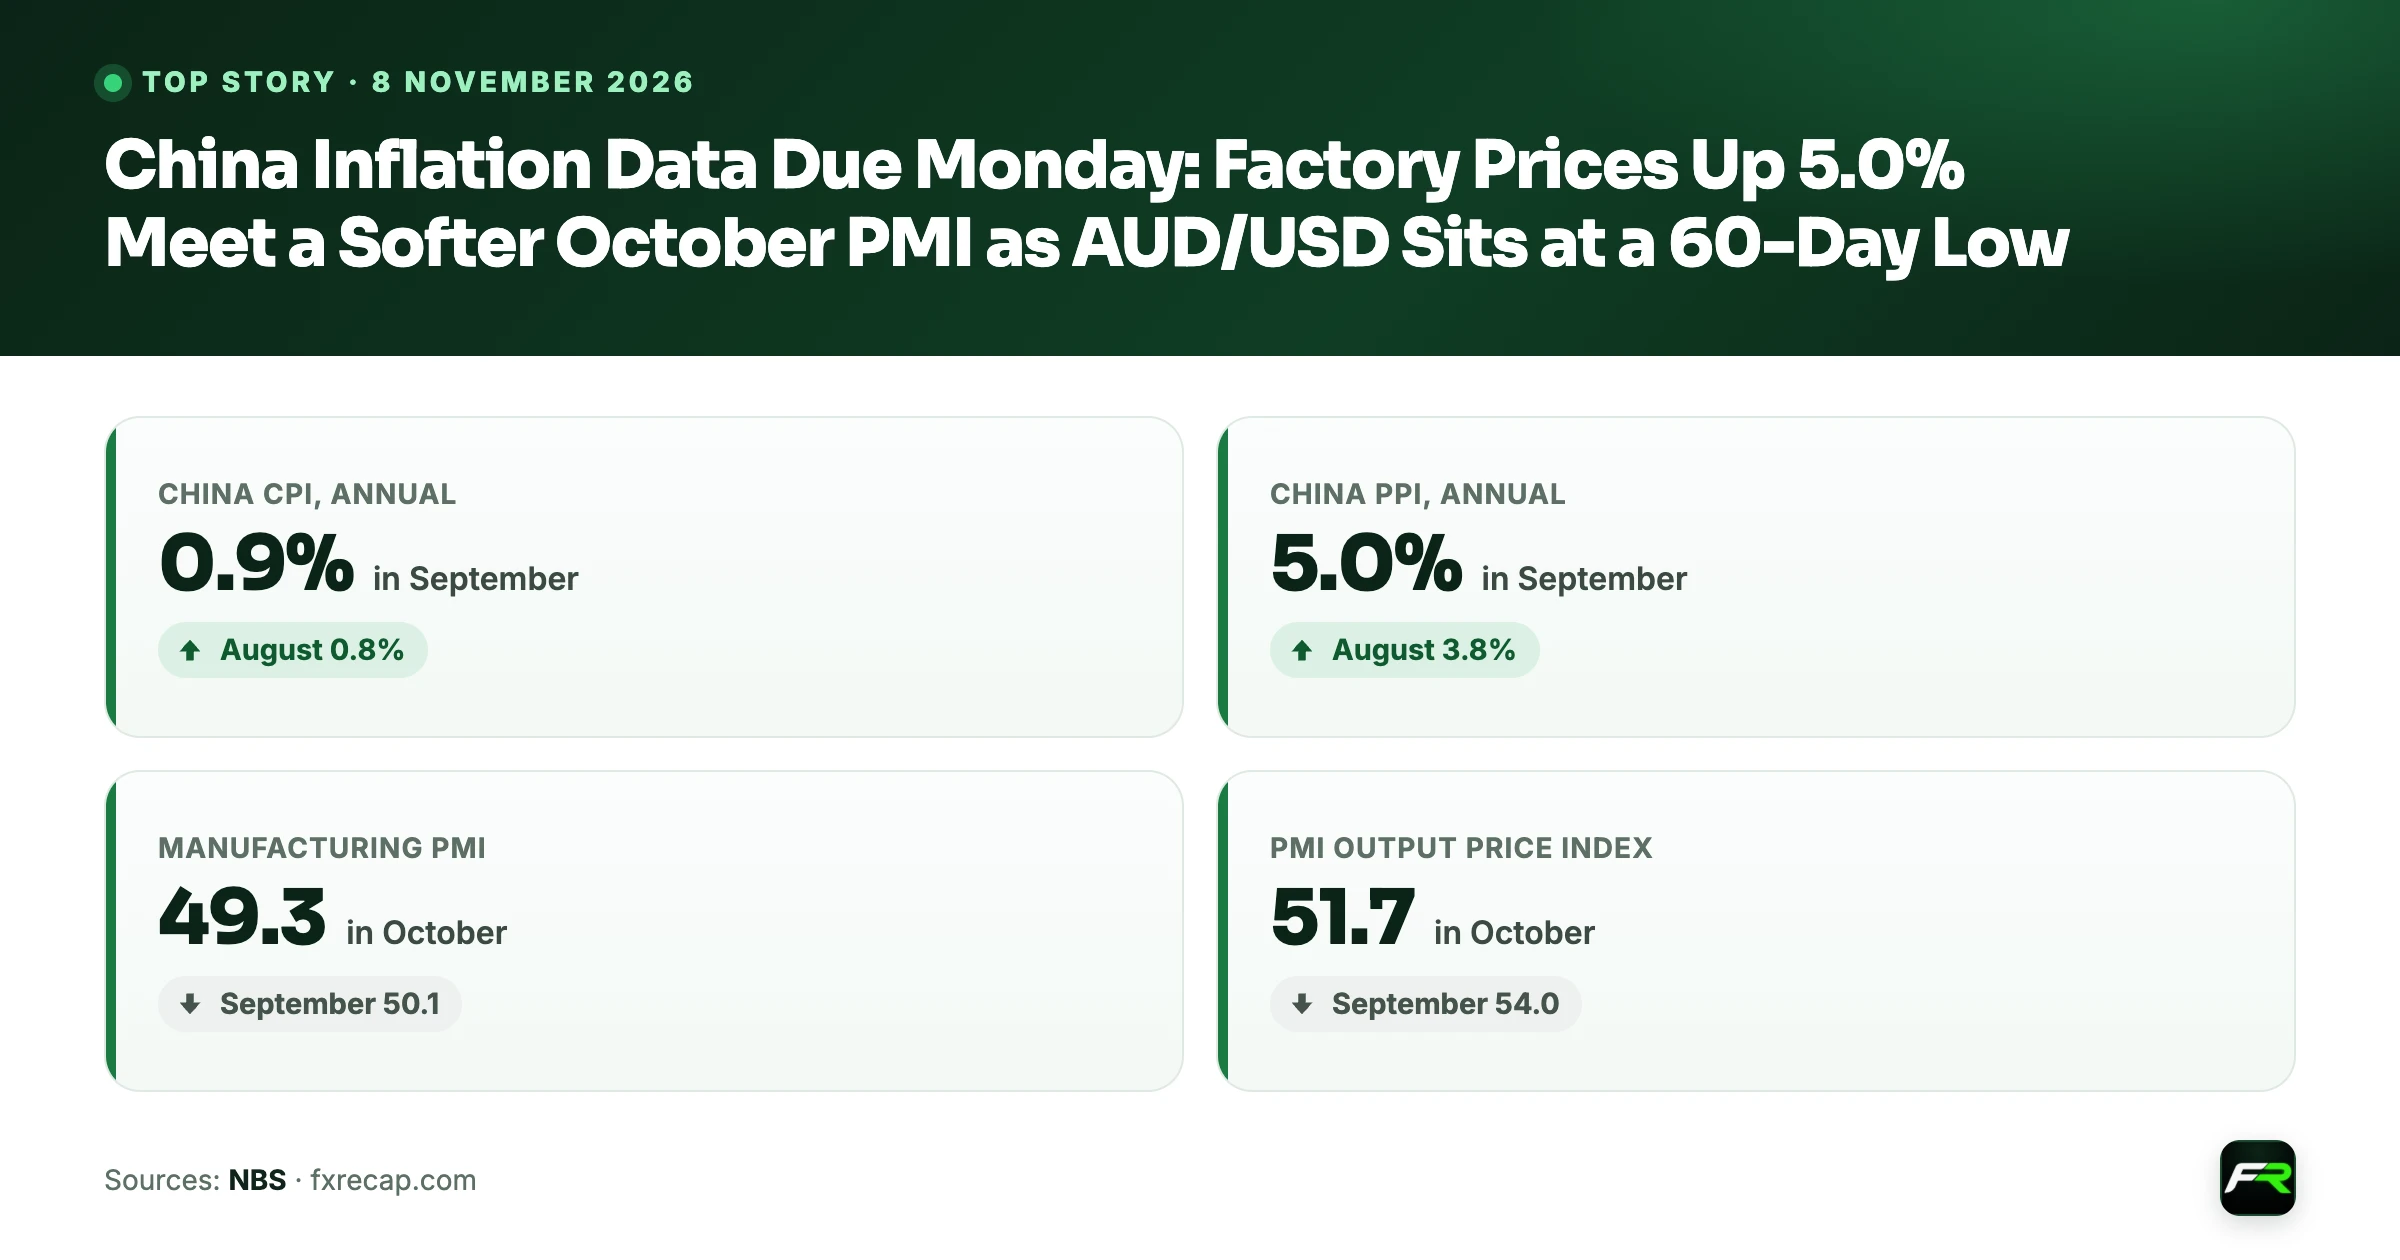
China's inflation has split in two. Factory-gate prices rose 5.0% over the year to September, driven by mining, metals and fuel, while consumer prices rose only 0.9% as food stayed cheaper than a year ago. October's survey data suggest the factory surge lost some pace. Monday's release will show whether that is true.
| China CPI, annual (NBS) | 0.9% in September (August 0.8%) |
|---|---|
| China PPI, annual (NBS) | 5.0% in September (August 3.8%) |
| Manufacturing PMI (NBS) | 49.3 in October (September 50.1) |
| PMI output price index (NBS) | 51.7 in October (September 54.0) |
Factory prices: the bigger story
September's producer price index was the striking number. Prices received by industrial firms rose 1.2% on the month and 5.0% on the year, up from 3.8% in August. Mining and quarrying prices were 25.4% higher than a year earlier and raw materials 9.4% higher, while consumer goods leaving the factory were slightly cheaper, down 0.1%.
Costs paid by producers rose even faster. The purchasing price index climbed 6.9% over the year, with nonferrous metals and cables up 20.0%, fuel and power up 13.6% and raw chemical materials up 12.6%. Those figures echo the energy shock seen in Europe, where October inflation reached 4.0% on energy prices 20.8% higher than a year ago.
The October purchasing managers' survey, published by the NBS on 1 November, points to some cooling. Its main raw materials purchase price index fell to 56.8 from 60.8, and the output price index to 51.7 from 54.0. Both stay above 50, which means more firms reported rising prices than falling ones, but fewer of them did so than in September.
The bureau's own price monitoring tells a similar story for late October. Of 50 key industrial products tracked from 21 to 31 October, 17 rose in price, 28 fell and 5 were flat compared with mid-October. Liquefied natural gas was a notable exception, up 10.9% to 7,481.9 yuan a tonne, while electrolytic copper eased 0.7%.
Consumer prices: still under 1%
Chinese households are seeing very little inflation. The consumer price index rose 0.9% over the year to September and 0.2% on the month. Food prices were 1.7% lower than a year earlier, with pork down 10.0% and fresh vegetables down 8.1%, while eggs were 14.3% dearer. Non-food prices rose 1.5%.
Core inflation, which leaves out food and energy, was 1.0% over the year in both August and September and flat on the month in September. Transport and telecommunication prices rose 4.3% on the year, the clearest sign of fuel costs reaching consumers. Services prices were up just 0.8%.
That gap matters. If producer prices keep climbing while consumer prices stay low, factories are absorbing higher costs in their margins. Over time that can either push retail prices up or squeeze profits and hiring. October's figures will help show which of those is happening.
Demand is softening too
Prices are only half of the October survey. The NBS manufacturing purchasing managers' index (PMI) fell to 49.3 from 50.1, slipping below the 50 line that separates growth from contraction. New orders dropped to 49.4 and new export orders to 48.7 from 50.0, so both home and foreign demand weakened. Large firms held just above 50, at 50.2, while medium and small companies fell to 48.4 and 47.5.
Services and construction cooled as well. The non-manufacturing business activity index eased to 49.7 from 50.2, and its sales price index fell to 49.5, meaning more service and building firms cut their prices than raised them. The composite output index, which combines both surveys, dropped a full point to 49.7.
Put together, the surveys describe an economy where input costs are still rising but firms are finding it harder to pass them on. That mix often shows up first in slower producer price growth, and only later in consumer prices. Monday's numbers are the first official test of that reading.
The yuan moved only a little. USD/CNY, derived from European Central Bank (ECB) reference rates, rose to 6.6713 on Friday from 6.6529 a week earlier, a change of about 0.3%. A large surprise in Monday's figures could move it more, and traders of other Asian currencies watch the yuan closely in the same session.
Why the Australian dollar cares
Traders often treat the Australian dollar as a gauge of Chinese demand, because Australia sells raw materials such as iron ore, coal and gas to Chinese industry. Data that changes the view of China's factories therefore tends to move AUD/USD. Rising producer prices for mining and metals usually support Australian export earnings. A weaker PMI, on the other hand, hints at softer demand for those same materials.
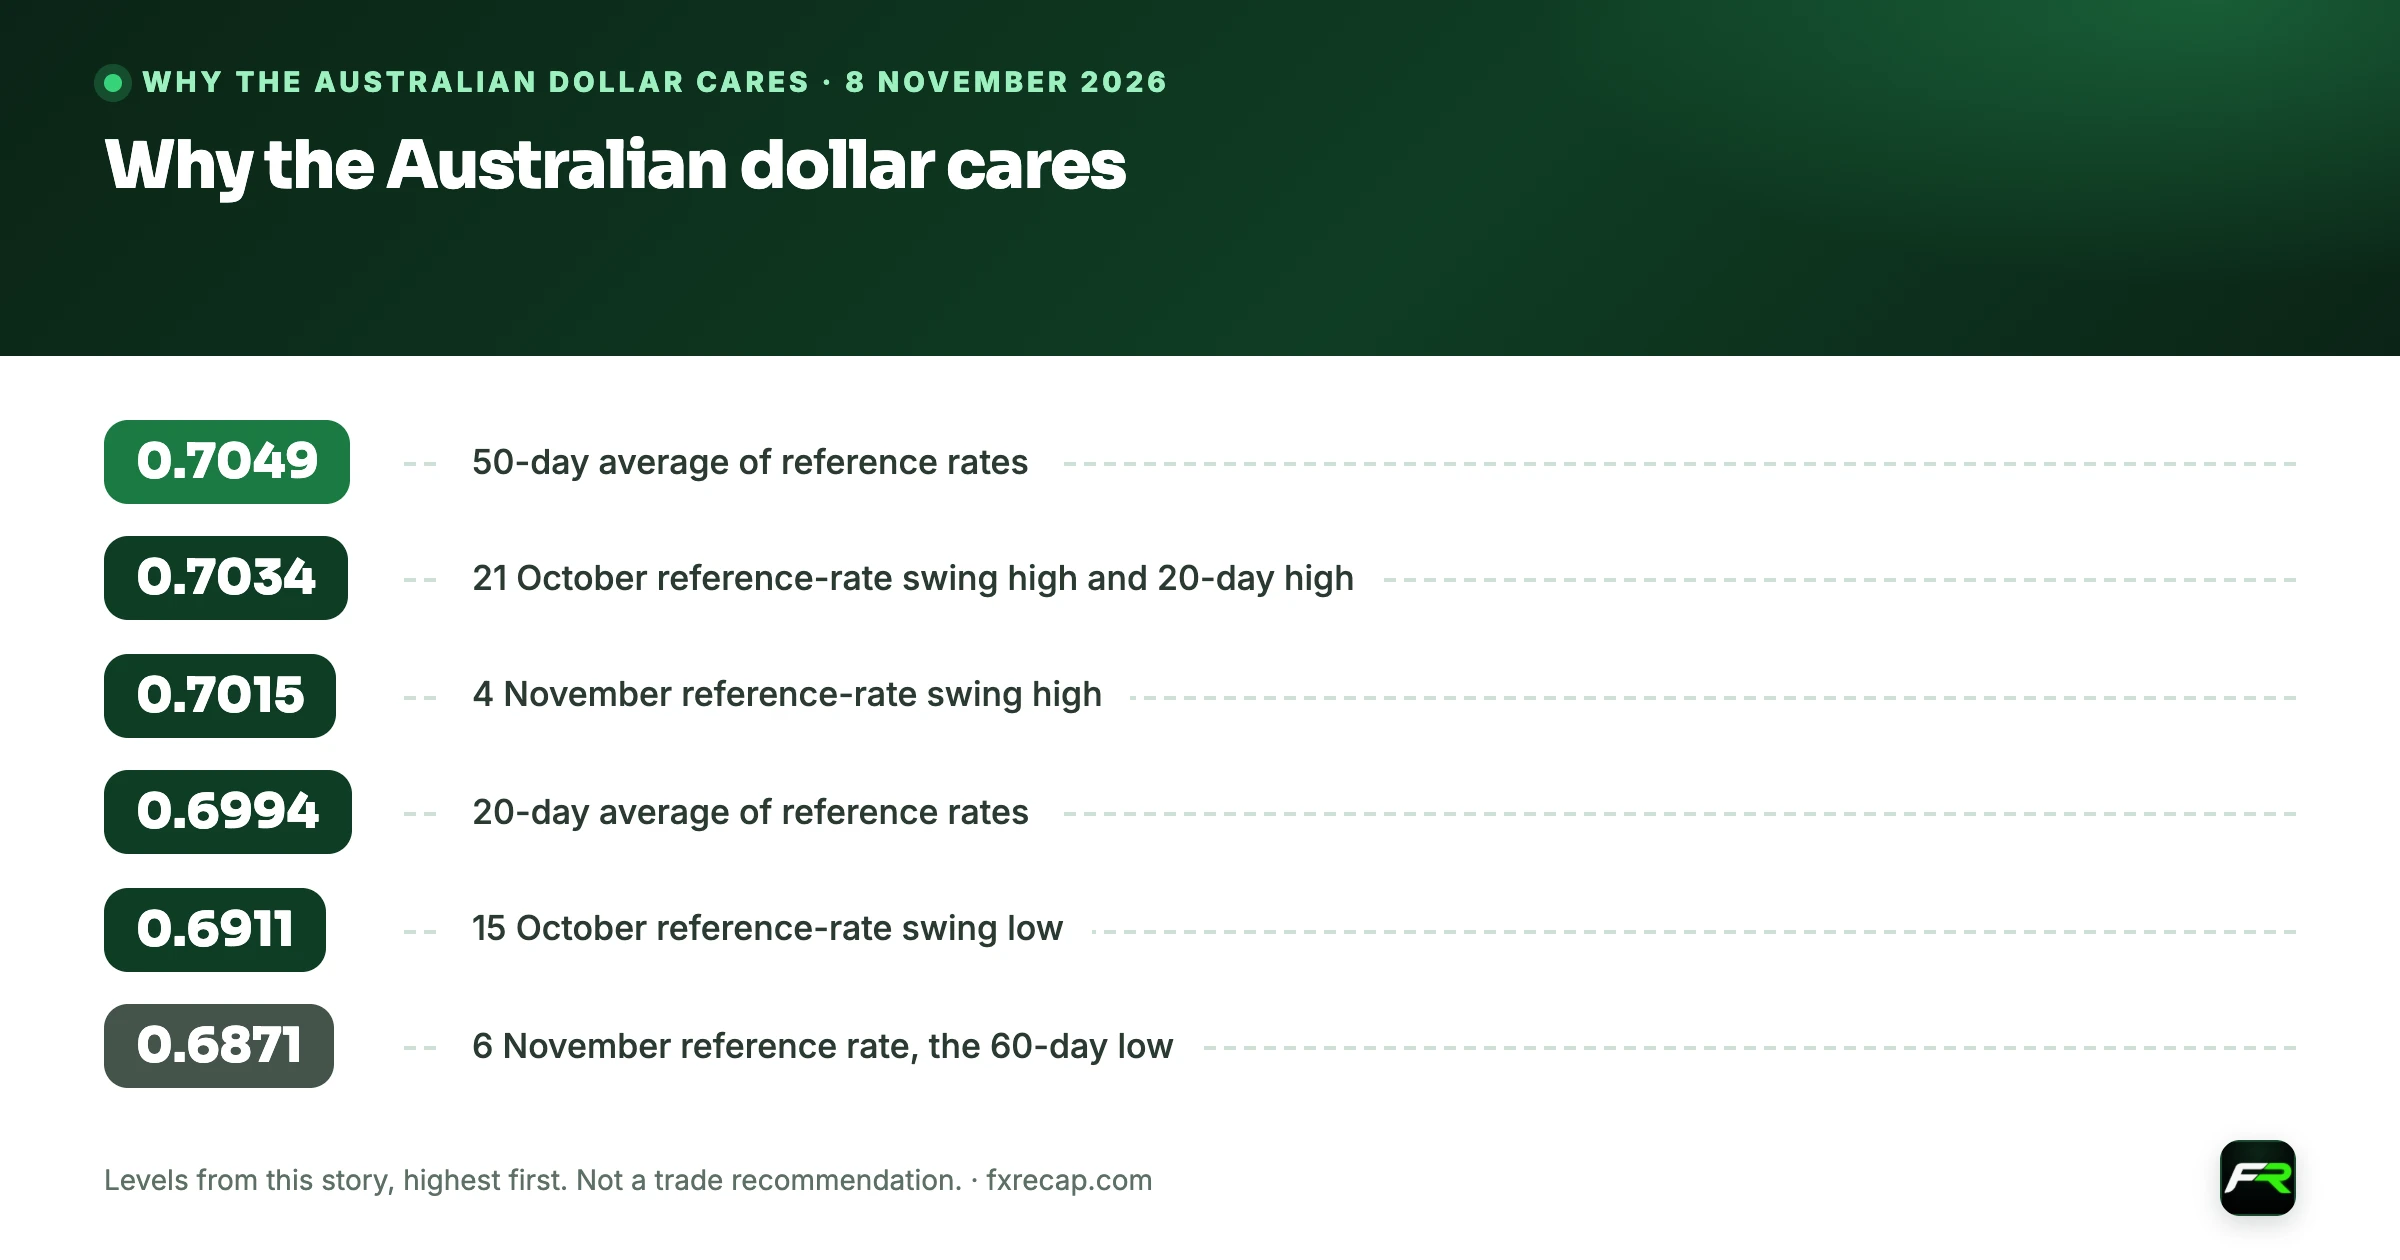
The currency enters the week on the back foot. AUD/USD's derived ECB reference rate fell to 0.6871 on Friday, the lowest in 60 working days, from 0.7001 on Thursday, and its 14-day relative strength index (RSI) on reference rates is about 31. The fall came even though the Reserve Bank of Australia raised its cash rate to 4.85% on Tuesday, a 6 to 3 vote.
The levels below come from those reference rates. They are daily fixings, not intraday highs or lows, so expect prices to trade around them rather than stop exactly on them.
| Level | Why it matters |
|---|---|
| 0.7049 | 50-day average of reference rates |
| 0.7034 | 21 October reference-rate swing high and 20-day high |
| 0.7015 | 4 November reference-rate swing high |
| 0.6994 | 20-day average of reference rates |
| 0.6911 | 15 October reference-rate swing low |
| 0.6871 | 6 November reference rate, the 60-day low |
A reference rate back above the 15 October low at 0.6911 would show Friday's break did not hold. Getting back to the 20-day average near 0.6994 would need a clear improvement in sentiment. Below 0.6871 there is no nearby reference-rate level from the last 60 days, which is one reason markets at fresh lows can move fast.
What to watch on Monday
- Read the producer price figure first. A smaller annual rise than September's 5.0% would match the softer PMI price gauges; a larger one would suggest the energy and metals surge is still spreading.
- Then check the monthly change. September's 1.2% monthly PPI rise was unusually big, so even a small October rise would slow the annual pace in coming months.
- Look at core consumer inflation. A move above 1.0% would hint that higher costs are reaching shoppers.
- Mind the timing. The data land at 01:30 UTC, when liquidity in AUD/USD is thinner than during the London session and spreads can be wider.
- Follow the live price and our levels on the AUD/USD analysis, and read the week in review for how the pair got here.
Say you want to sell AUD/USD if Monday's data disappoint, entering at 0.6860 with a stop at 0.6915, just above the 15 October low, 55 pips away. On a $2,000 account risking 1%, your maximum loss is $20, so each pip can be worth about $0.36, roughly 3,600 units. If thin early liquidity fills the stop 15 pips late, the loss becomes about $25. Size it in advance with our <a href="/position-size-calculator">position size calculator</a>.
Asian-session data can move thinly traded markets sharply, and stop orders may fill at worse prices than planned. Leverage magnifies losses as well as gains, so only trade money you can afford to lose. This article is news and education, not a recommendation to buy or sell.
Release time is from the National Bureau of Statistics 2026 release calendar. CPI, PPI, PMI and price-monitoring figures are from NBS releases for August to October 2026. AUD/USD and USD/CNY are derived from ECB euro reference rates. RBA details are from its 3 November 2026 statement.
Cite this guide
FX Recap, "China Inflation Data Due Monday: Factory Prices Up 5.0% Meet a Softer October PMI as AUD/USD Sits at a 60-Day Low", updated 8 November 2026, https://fxrecap.com/forex-news/top-stories/china-october-cpi-ppi-preview-aud
Free to quote with a link. Journalists: data and comment in our press room.
Frequently asked
When is China's October 2026 CPI released?
The National Bureau of Statistics publishes October's consumer and producer price indexes on Monday 9 November 2026 at 09:30 Beijing time, which is 01:30 UTC.
What was China's inflation rate in September 2026?
Consumer prices rose 0.9% over the year to September, up from 0.8% in August. Core inflation, excluding food and energy, was 1.0%.
Why did China's producer prices rise so much?
PPI rose 5.0% over the year to September, led by mining and quarrying (up 25.4%) and raw materials (up 9.4%). Purchasing prices for nonferrous metals rose 20.0% and fuel and power 13.6%.
How does Chinese data affect the Australian dollar?
Australia sells raw materials such as iron ore, coal and gas to Chinese industry, so figures that change the outlook for Chinese industry often move AUD/USD, especially in the Asian session when the data are released.
Sources: National Bureau of Statistics of China: Industrial Producer Price Indexes, September 2026 · National Bureau of Statistics of China: Consumer Price Index, September 2026 · National Bureau of Statistics of China: Purchasing Managers' Index, October 2026 · National Bureau of Statistics of China: Regular Press Release Calendar 2026 · National Bureau of Statistics of China: Market Prices of Means of Production, 21-31 October 2026 · National Bureau of Statistics of China: Consumer Price Index, August 2026 · ECB: euro foreign exchange reference rates
The team behind this guide
Researched, checked and approved by five forex specialists
Every guide is written, fact-checked and edited before it goes live, and updated when the facts change. Spotted an error? Tell us.