IC Markets

 3:09
 2:39
 2:10
 2:18
 3:43
 8:42






































Gold Falls 1.6% to $4,046 After US Inflation Data Lifts Real Yields to a Three-Week High
Spot gold slipped from $4,112 as firm US core prices pushed the 10-year real yield up 12 basis points to 2.78%, its highest close since 19 October.
 WriterAbir KhanWriterWrites the guides · checks every figure against primary sources View profileAbout Abir →

 Market analysisTanbir Habib RiyadForex & Crypto AnalystForex and crypto analyst · technical and fundamental analysis View profileAbout Tanbir →

 Fact-checking & riskJannatul FerdaushFact-Checker & Risk AnalystFact-checks every figure · risk analysis · Applied Statistics, University of Dhaka View profileAbout Jannatul →

 Trading reviewJowel RanaForex TraderForex trader · reviews guides from a trader's view View profileAbout Jowel →

 Final approvalRanjan N. MondolForex TraderForex trader · signs off every guide View profileAbout Ranjan →

Gold lost ground after the US inflation report. Spot gold was $4,045.60 at 03:03 UTC on Wednesday 11 November, according to gold-api.com, down from $4,112.40 at 04:12 UTC on Tuesday, before the data. That is a fall of $66.80, or 1.6%, and it takes the metal back to about its 6 November level.
The trigger was the bond market. US consumer prices rose 0.4% in October and core prices 0.3% for a third straight month, the Bureau of Labor Statistics said, and Treasury yields jumped. The 10-year real yield, the return on inflation-protected Treasuries after inflation, rose to 2.78% from 2.66%, its highest close since 19 October, according to the US Treasury.
| Spot gold (gold-api.com) | $4,045.60 at 03:03 UTC on 11 November (previous reading $4,112.40) |
|---|---|
| 10-year real yield (US Treasury) | 2.78% on 10 November (previous 2.66%) |
| 5-year real yield (US Treasury) | 2.56% on 10 November (previous 2.42%) |
| 10-year Treasury yield (US Treasury) | 4.98% on 10 November (previous 4.88%) |
Why real yields matter for gold
Gold pays no interest. When investors can earn a higher return after inflation on a safe government bond, the cost of holding gold instead goes up, and some money tends to move out of the metal. That is why traders watch real yields, not just headline yields, when they trade gold.
Tuesday's move was large for a single day. The 10-year real yield rose 12 basis points, the 5-year rose 14 to 2.56% and the 30-year 9 to 3.17%. Nominal yields climbed too: the 10-year Treasury yield closed at 4.98% against 4.88%, and the 2-year at 4.73% against 4.56%. Inflation expectations, the gap between nominal and real yields, edged down slightly at the 10-year point, so the rise came from higher real rates.
The link is not mechanical. Central bank buying, demand in India and China, and safe-haven flows during political or market stress can all lift gold while real yields rise. Over a day like Tuesday, though, when the only big news is a firm inflation number, the real-yield channel usually dominates.
What the CPI report changed
Before the release, the Cleveland Fed's inflation nowcast pointed to 0.24% for all items and 0.21% for core. The outcome, 0.4% and 0.3%, landed above both. Food rose 0.5%, transportation services 0.8% and motor vehicle insurance 0.7%, while energy added only 0.7% after September's 5.2% jump. The full breakdown is in our US CPI report.
For gold the key point is the Fed. The central bank held its target range at 3.75% to 4.00% on 28 October with two votes for a rise, and the next decision is on 9 December. November's CPI is not due until 10 December, the day after that meeting, so October's figures are the last consumer price data officials will see before they vote. A higher chance of a December rise means higher expected real rates, which weighs on the metal.
Our readings over the past week
These are FX Recap's logged spot gold readings from gold-api.com. Each is a single snapshot taken when we update our gold analysis, mostly in the early hours UTC, so they show the trend rather than daily highs or lows.
| Reading | Spot gold, $ an ounce |
|---|---|
| 2 Nov | $3,907.20 |
| 4 Nov | $4,018.30 |
| 5 Nov | $4,138.40 |
| 6 Nov | $4,045.50 |
| 7 Nov | $4,072.10 |
| 9 Nov | $4,103.30 |
| 10 Nov | $4,112.40 |
| 11 Nov | $4,045.60 |
The pattern is a rally from the 31 October low of $3,876.40 to $4,138.40 on 5 November, a dip the next day, a slow recovery into the CPI release and then Tuesday's drop. Wednesday's reading is almost the same as 6 November's, so the recovery of the past few days has been erased, but gold is still well above its late-October levels.
Gold levels to watch
These levels come from our gold-api.com price log, which holds about 20 readings so far. That is too short for a 50-day or 100-day average, so we use the highs, lows and turning points of the log instead.
| Level | Why it matters |
|---|---|
| $4,138.40 | 5 November reading, the highest in our log |
| $4,112.40 | 10 November reading before the US CPI release |
| $4,072.10 | 7 November reading, the middle of last week's recovery |
| $4,018.30 | 4 November reading, the first above $4,000 this month |
| $4,000.00 | Round number; every reading since 4 November is above it |
| $3,876.40 | 31 October reading, the lowest in our log |
A return above $4,112 would show that the CPI reaction has faded. A break below $4,018 and then $4,000 would put the late-October low back in view. Real yields are the input to watch: if the 10-year real yield keeps climbing toward the 2.84% of 14 October, pressure on gold is likely to continue.
The dollar and the days ahead
The dollar side of the move is harder to measure on official data. EUR/USD's European Central Bank (ECB) reference rate on Tuesday, 1.1214, was set at about 13:15 UTC, a quarter of an hour before the CPI release, so it cannot show the reaction. Wednesday's reference rate will be the first to include it. Gold priced in dollars tends to fall when the dollar rises, so a lower euro rate on Wednesday would confirm that both channels, yields and the currency, worked against the metal.
Three scheduled events can change things before the weekend. Britain publishes its first estimate of third-quarter GDP on Thursday at 07:00 UTC, which matters for the pound and the dollar's broad value. The BLS publishes October producer prices on Friday at 13:30 UTC, after September's 1.3% jump in final demand prices. Fed officials also speak through the month before the quiet period ahead of the 9 December meeting, and any hint about December will feed straight into real yields.
Central bank demand is the slower force on the other side. China's State Administration of Foreign Exchange reported gold holdings of 78.30 million ounces at the end of October, up 830,000 ounces on the month. Purchases like these do not react to a single inflation report, so they can cushion a fall without stopping it.
What it means for traders
- Watch the US Treasury's real yield data each evening. A further rise above 2.80% would be a headwind for gold; a fall back toward 2.60% would ease it.
- Friday's US producer price index at 13:30 UTC is the next test. September's PPI jumped 1.3%, so another big rise could lift yields again.
- Gold priced in other currencies moves differently. For traders in India, the rupee's own move against the dollar changes the local price, so check the conversion before acting on a dollar chart.
- Size positions for volatility. A $66 move in a day is about 1.6%, and a stop that is too close can be hit by normal swings.
- Our gold analysis shows the live price and the levels we track, and the China gold reserves story covers central bank demand.
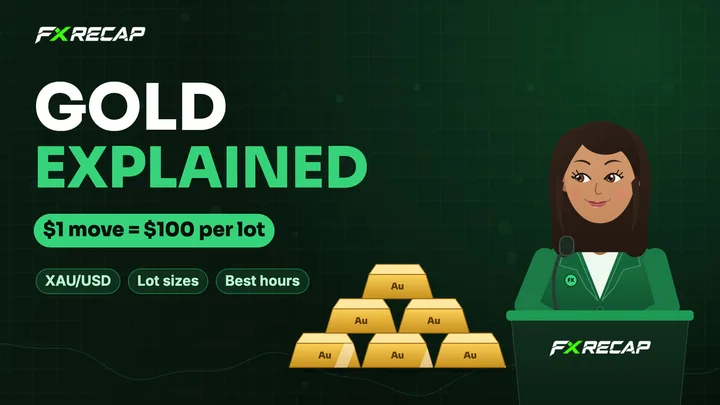
Say you buy gold at $4,045 expecting the $4,000 area to hold, with a stop at $3,995. That is $50 of risk per ounce. On a $5,000 account risking 1%, your limit is $50, so you can hold about 1 ounce, which is 0.01 lots at many brokers where 1 lot is 100 ounces. If the stop slips $10 in a fast market, the loss rises to about $60. Use our <a href="/position-size-calculator">position size calculator</a> to check your own size.
Gold can move by tens of dollars within minutes around US data, and stop orders may fill at worse prices than planned. Leverage magnifies losses as well as gains, so only trade money you can afford to lose. This is news and education, not a recommendation to buy or sell.
Spot gold readings are from gold-api.com, logged by FX Recap at the times shown. Real and nominal yields are US Treasury daily real and par yield curve rates. CPI figures are from the BLS release of 10 November 2026, the nowcast from the Federal Reserve Bank of Cleveland and Fed details from the Federal Open Market Committee (FOMC) statement of 28 October 2026.
Cite this guide
FX Recap, "Gold Falls 1.6% to $4,046 After US Inflation Data Lifts Real Yields to a Three-Week High", updated 11 November 2026, https://fxrecap.com/forex-news/top-stories/gold-falls-after-us-cpi-real-yields
Free to quote with a link. Journalists: data and comment in our press room.
Frequently asked
Why did gold fall after the US CPI report?
October's CPI rose 0.4% with core at 0.3%, above nowcast estimates. US real yields jumped, with the 10-year rising to 2.78% from 2.66%, which raised the cost of holding gold, a metal that pays no interest.
What is the gold price today?
Spot gold was $4,045.60 at 03:03 UTC on 11 November 2026, according to gold-api.com, down from $4,112.40 at 04:12 UTC on 10 November. Our gold analysis page shows the live price.
What is a real yield?
A real yield is the return on a government bond after inflation. The US Treasury publishes real yields from inflation-protected securities (TIPS) every business day.
What could move gold next?
US producer prices on 13 November, Fed speeches before the 9 December decision and the daily real yield data are the main scheduled drivers.
Sources: US Treasury: daily real yield curve rates, November 2026 · US Bureau of Labor Statistics: Consumer Price Index, October 2026 · gold-api.com: spot gold price · US Treasury: daily par yield curve rates, November 2026 · Federal Reserve Bank of Cleveland: Inflation Nowcasting
The team behind this guide
Researched, checked and approved by five forex specialists
Every guide is written, fact-checked and edited before it goes live, and updated when the facts change. Spotted an error? Tell us.