IC Markets




































Gold Climbs Back Toward $4,180 After a CPI Sell-Off to $4,095
Gold futures lost $67 within hours of the hot US inflation report, then recovered it all overnight. Spot gold held near $4,157 early on Thursday.
 WriterAbir KhanWriterWrites the guides · checks every figure against primary sources View profileAbout Abir →
 Market analysisTanbir Habib RiyadForex & Crypto AnalystForex and crypto analyst · technical and fundamental analysis View profileAbout Tanbir →
 Fact-checking & riskJannatul FerdaushFact-Checker & Risk AnalystFact-checks every figure · risk analysis · Applied Statistics, University of Dhaka View profileAbout Jannatul →
 Trading reviewJowel RanaCo-Founder & Forex TraderCo-founder · forex trader · reviews guides from a trader's view View profileAbout Jowel →
 Final approvalRanjan NiskrityFounder, Owner & Forex TraderFounder and owner · forex trader · signs off every guide View profileAbout Ranjan →
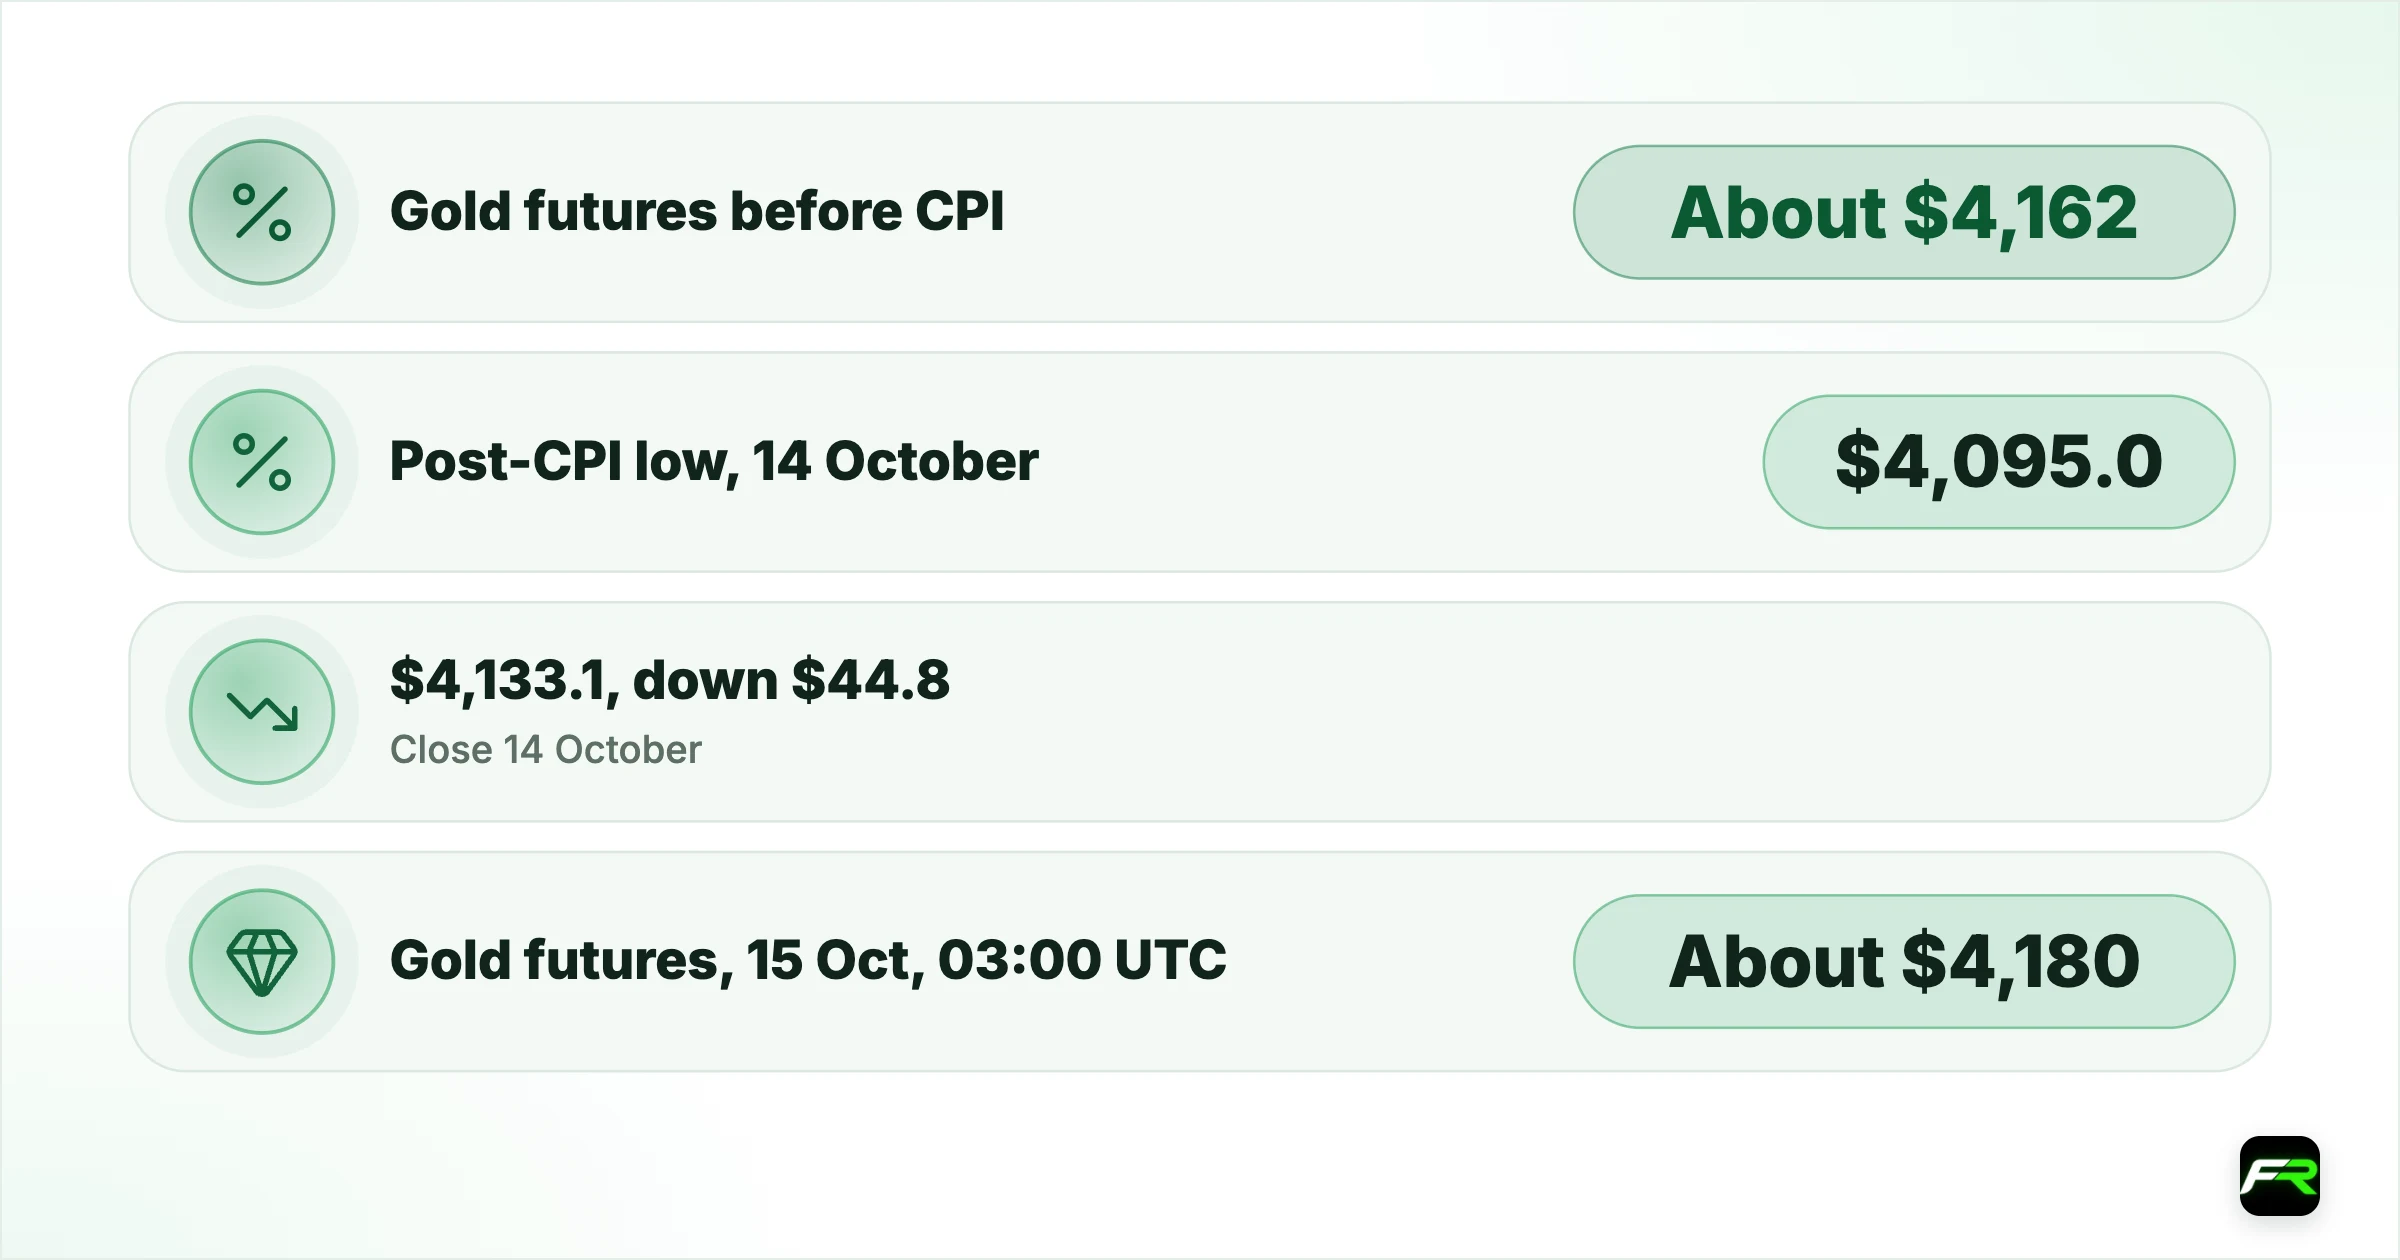
Gold had a rough Wednesday and a quick recovery. COMEX gold futures fell from about $4,162 just before the US consumer price report to $4,095 in the following hours, a drop of $67, and closed the UTC day at $4,133.10, down $44.80. By 03:00 UTC on Thursday they were back near $4,180, above where they stood before the data. Spot gold traded near $4,157 at 03:07 UTC.
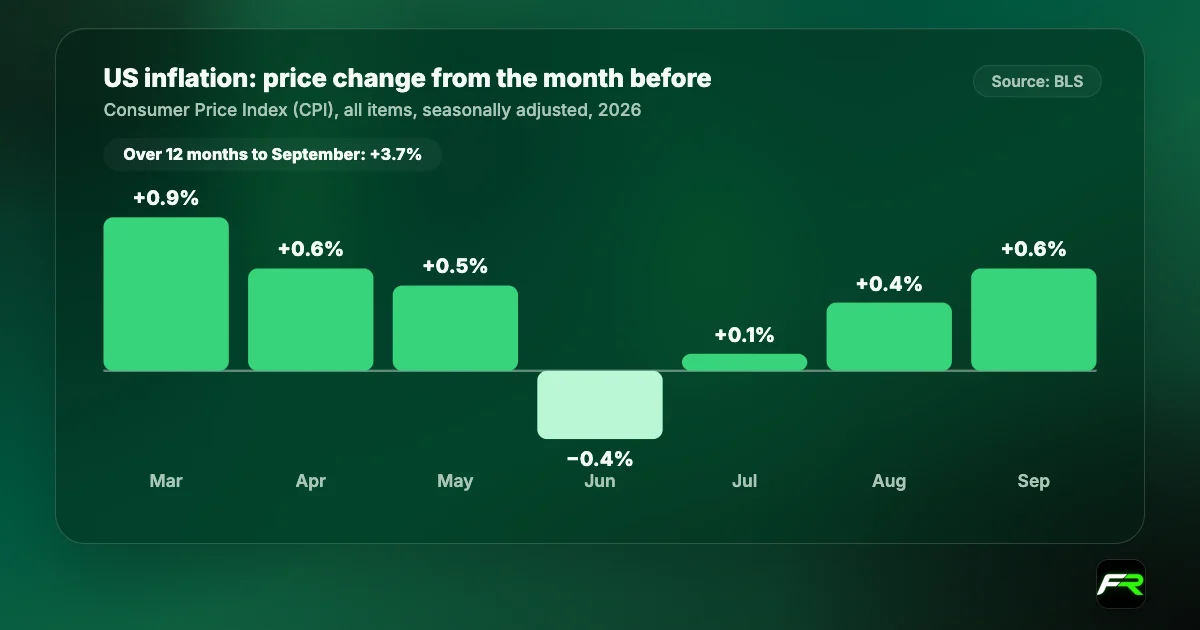
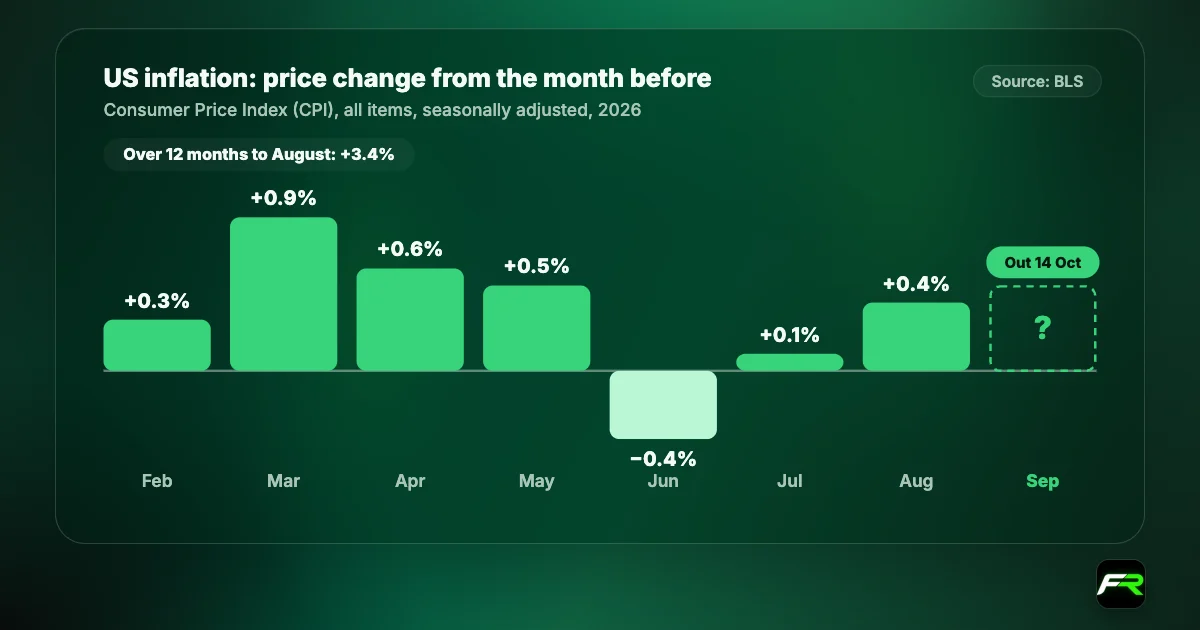
The trigger was September's inflation report from the Bureau of Labor Statistics, which showed consumer prices up 0.6% on the month and 3.7% over the year, up from 3.4% in August. A hotter number tends to lift bets on further Federal Reserve rate rises, which makes holding gold, an asset that pays no interest, less attractive.
| Gold futures before CPI (12:00 UTC) | About $4,162 |
|---|---|
| Post-CPI low, 14 October | $4,095.0 |
| Close 14 October | $4,133.1, down $44.8 |
| Gold futures, 15 Oct, 03:00 UTC | About $4,180 |
| Spot gold, 15 Oct, 03:07 UTC | About $4,157 |
| US CPI, September (BLS) | +0.6% on the month, 3.7% over the year |
| 30-year Treasury yield, 14 Oct | 5.52%, lowest close since 25 September |
Why gold fell on the CPI report
The first reaction followed the textbook. A strong headline inflation number pushed the dollar higher, and the dollar index climbed from about 102.24 to 102.95 in the hours after the 12:30 UTC release. That makes gold more expensive for buyers outside the United States, and the prospect of higher US rates raises the cost of holding a metal that earns no yield. Futures hit their low of $4,095 during the US afternoon.
Short-dated bonds echoed that reaction. The US Treasury's daily data show the 2-year yield rising to 4.82% on Wednesday from 4.79% on Tuesday. This maturity is the part of the curve most sensitive to expectations for the Fed's next moves, so its rise reflected a little more tightening being priced in.
The low held just above last week's $4,091 futures low from 7 October, and that area has now stopped two sell-offs in a week. Chart traders will see it as a double bottom in the making, though it only becomes one if prices clear the highs between the two lows, near $4,240.
Why it bounced back so quickly
Two things changed during the session. The first was the detail of the CPI report. Most of the jump came from gasoline, which rose 9.1% in the month, while core inflation, excluding food and energy, rose 0.3% for a second month. Traders who read the release as an energy shock rather than broad price pressure had less reason to bet on an aggressive Fed.
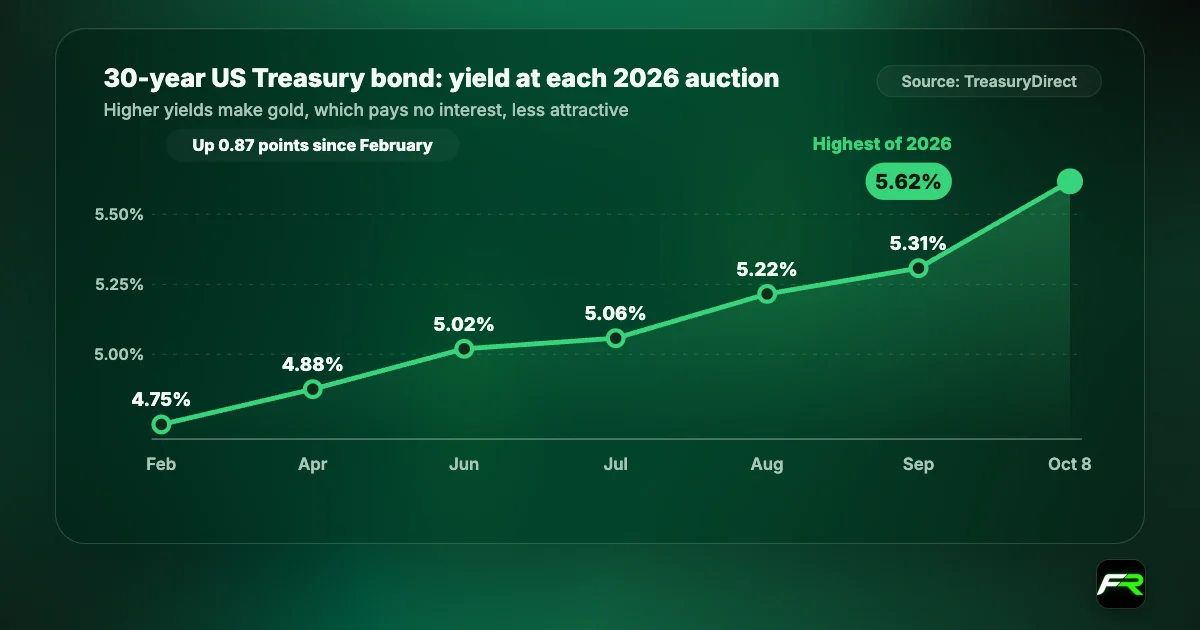
The second was the long end of the bond market. While the 2-year yield rose, the 10-year fell to 5.19% and the 30-year to 5.52%, both their lowest closes since 25 September, according to the Treasury. Gold had tracked the 30-year yield closely last week, rising as it fell; on Wednesday that link broke for a few hours as the dollar dominated, then reasserted itself as the dollar faded. The table shows the last seven sessions.
Another way to see the shift is the gap between short and long yields. On 7 October the 30-year yield stood 90 basis points above the 2-year (5.67% against 4.77%). By 14 October that gap had narrowed to 70 basis points (5.52% against 4.82%), according to Treasury data. A flatter curve of this kind usually means markets expect tighter policy in the near term but slower growth or calmer inflation further out, a mix that is usually less hostile to gold than a broad rise in yields across the curve.
| Day | Gold futures close | Change | 2-year yield | 30-year yield |
|---|---|---|---|---|
| Tue 6 Oct | $4,193.6 | +$32.2 | 4.79% | 5.64% |
| Wed 7 Oct | $4,133.0 | −$60.6 | 4.77% | 5.67% |
| Thu 8 Oct | $4,169.2 | +$36.2 | 4.75% | 5.60% |
| Fri 9 Oct | $4,216.3 | +$47.1 | 4.80% | 5.60% |
| Mon 12 Oct | $4,194.3 | −$22.0 | Closed | Closed |
| Tue 13 Oct | $4,177.9 | −$16.4 | 4.79% | 5.56% |
| Wed 14 Oct | $4,133.1 | −$44.8 | 4.82% | 5.52% |
Gold futures: UTC daily candles built from hourly market data. Yields: US Treasury daily par yield curve; the bond market was closed on 12 October for Columbus Day.
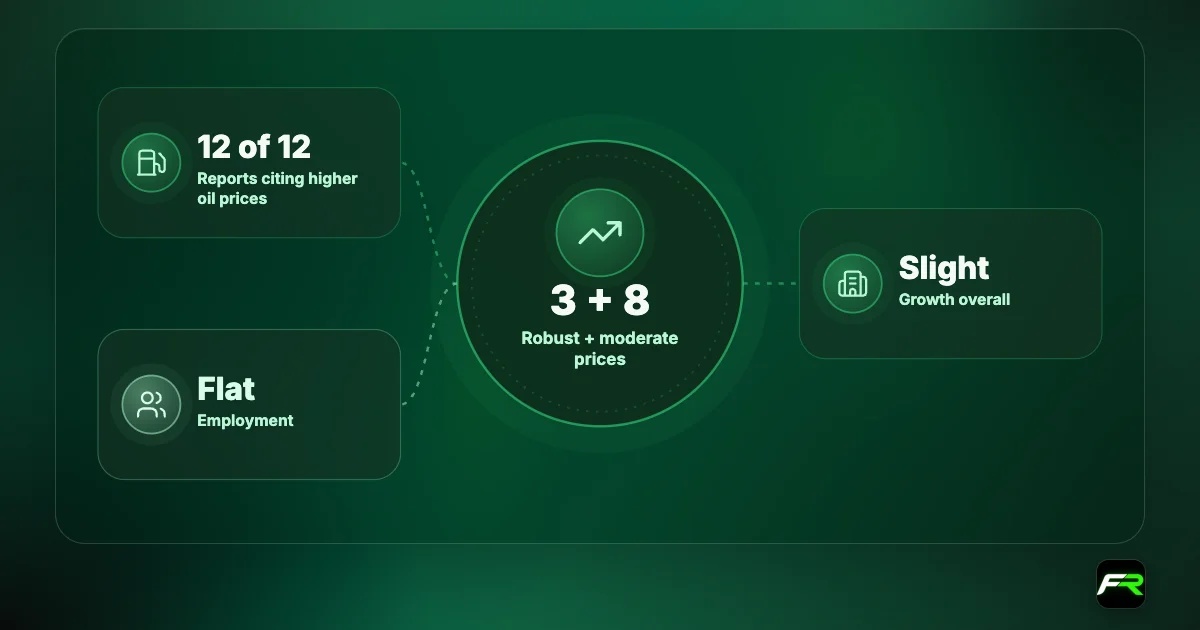
The Fed's Beige Book, released the same day, also mattered. It described flat employment across most of the country alongside rising price pressure, a mix that leaves the Fed's next move open. Our Beige Book story has the details.
Where gold stands on the chart
The bigger trend is still down. Gold futures peaked at $4,558.50 on 3 September and have made lower highs since. Futures trade below their 20-day average, about $4,244, as well as the 50-day near $4,380 and the 100-day near $4,282. In spot terms, subtract roughly $23 from each, which puts the 20-day average near $4,220.
Shorter term, the chart looks more balanced. Two defended lows near $4,091 and $4,095 suggest buyers are active below $4,100, and the 14-day RSI near 39 is soft but not oversold. A daily close above the 20-day average would be the first sign that the September downtrend has ended, while a close below $4,090 in futures, about $4,067 in spot, would open the $4,000 round number.
Our gold analysis today has the full set of spot levels and three trade plans for the session.
What traders should watch next
US producer prices for September are due today at 12:30 UTC. A big rise in energy-related producer costs would revive inflation worries and could push the dollar and short-dated yields higher again. Beyond that, the next major event is the Fed's rate decision on 28 October, the last before October CPI data arrives on 10 November.
Oil is the wild card. Energy prices drove September's inflation surge, and every Fed district mentioned fuel costs in the Beige Book. If crude keeps climbing, inflation fears could lift yields and weigh on gold; a sharp escalation in the Middle East could instead spark safe-haven buying. That two-way risk is why gold's daily swings have been so wide.
- Size gold trades with the gold lot size calculator; a $67 move like Wednesday's is $6,700 on one standard lot.
- Watch both ends of the Treasury curve: the 2-year for Fed expectations and the 30-year for gold's medium-term direction.
- Avoid opening new positions in the minutes around today's 12:30 UTC producer price release.
- Check whether your broker quotes spot gold or a futures-based price; the two were about $23 apart this morning.
A trader in Mumbai buys 0.10 lots of XAU/USD (10 ounces) at $4,150 spot with a stop at $4,110, just under Wednesday's spot-equivalent low. Each $1 move is worth $10, so the stop risks $400, or about ₹38,000 at 95.1 rupees per dollar. The first target is the 20-day average near $4,220, worth $700. Wednesday showed that gold can travel $60 in a few hours, so the trader keeps the size small enough that a stop-out is an annoyance, not a disaster.
Gold CFDs are leveraged, and fast moves around data releases can push losses past a stop. Trade only with money you can afford to lose.
Inflation figures are from the US Bureau of Labor Statistics, and yields are from the US Treasury's daily par yield curve. Gold prices are market data (COMEX futures from hourly bars, and spot gold) and differ slightly between providers. Moving averages and RSI are FX Recap calculations from UTC daily closes. This is news, not investment advice.
Frequently asked
Why did gold fall on 14 October 2026?
US consumer prices rose 0.6% in September and 3.7% over the year, according to the BLS. The dollar and the 2-year Treasury yield rose after the report, and gold futures fell to $4,095 before recovering.
What is the gold price today?
Spot gold traded near $4,157 an ounce at 03:07 UTC on 15 October 2026, with COMEX futures about $23 higher near $4,180. Prices differ slightly between providers.
Is gold still in a downtrend?
On the daily chart, yes. Gold has made lower highs since early September and trades below its 20, 50 and 100-day averages. A daily close above the 20-day average, near $4,220 in spot terms, would be the first sign of a turn.
What could move gold next?
US producer prices today at 12:30 UTC, Treasury yields, oil prices and the Federal Reserve's rate decision on 28 October.
Sources: US Bureau of Labor Statistics: Consumer Price Index, September 2026 · US Treasury: daily par yield curve rates · Federal Reserve: Beige Book, October 2026
The team behind this guide
Researched, checked and approved by five forex specialists
Every guide is written, fact-checked and edited before it goes live, and updated when the facts change. Spotted an error? Tell us.