IC Markets




































US Retail Sales Rise 0.8% in September, but Gas Stations Do the Heavy Lifting
Gas station receipts jumped 6.4% while spending outside autos and fuel grew only 0.2%, a soft signal for the dollar two weeks before the Fed meets.
 WriterAbir KhanWriterWrites the guides · checks every figure against primary sources View profileAbout Abir →
 Market analysisTanbir Habib RiyadForex & Crypto AnalystForex and crypto analyst · technical and fundamental analysis View profileAbout Tanbir →
 Fact-checking & riskJannatul FerdaushFact-Checker & Risk AnalystFact-checks every figure · risk analysis · Applied Statistics, University of Dhaka View profileAbout Jannatul →
 Trading reviewJowel RanaCo-Founder & Forex TraderCo-founder · forex trader · reviews guides from a trader's view View profileAbout Jowel →
 Final approvalRanjan NiskrityFounder, Owner & Forex TraderFounder and owner · forex trader · signs off every guide View profileAbout Ranjan →
American shoppers spent more in September, but mostly because fuel cost more. The Census Bureau said on Thursday that retail and food services sales rose 0.8% to $745.0 billion, after a 1.3% gain in August that was revised up from 1.1%. Sales were 6.3% higher than a year earlier.
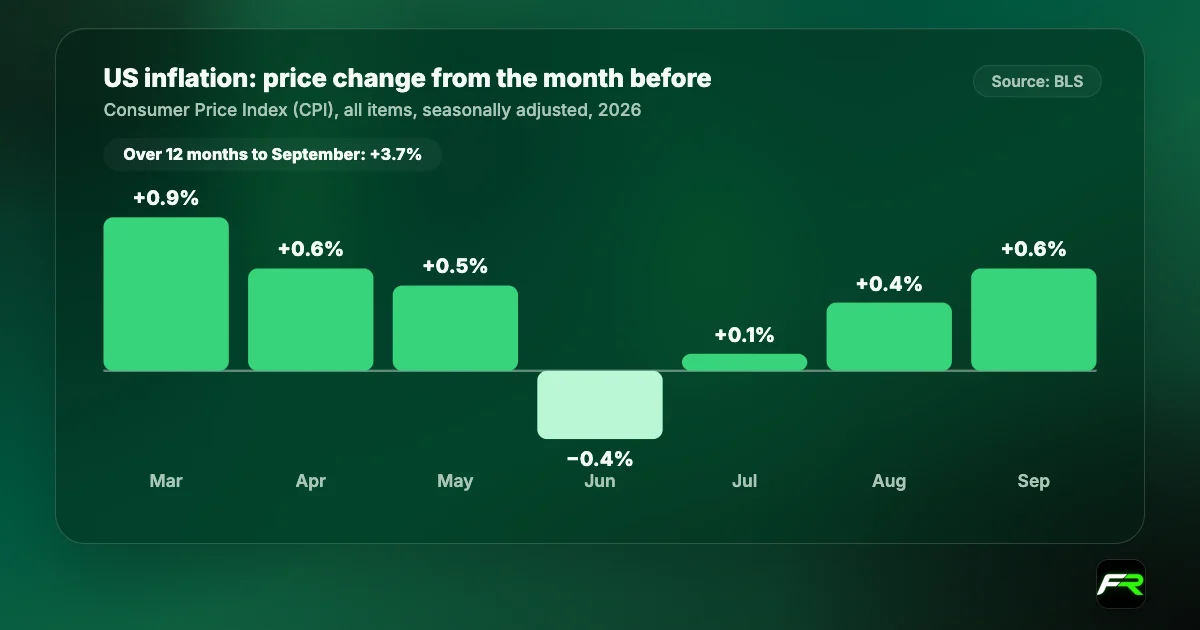
Strip out the pumps and the picture is much flatter. Sales at gasoline stations rose about 6.4% on the month, by our calculation from the Census tables. Sales excluding motor vehicles and gasoline stations grew only 0.2%, and the Census Bureau notes that this change is not statistically different from zero. Because the figures are not adjusted for prices, and consumer prices rose 0.6% in September, real spending outside fuel probably fell slightly.
| Retail and food services, September | $745.0 billion, +0.8% on the month |
|---|---|
| August (revised) | +1.3%, up from +1.1% |
| Over 12 months | +6.3% |
| Excluding motor vehicles | +0.9% |
| Excluding autos and gasoline | +0.2% (not statistically significant) |
| Gasoline stations | About +6.4% on the month (our calculation) |
| Next report | October sales on 17 November |
Where the money went in September
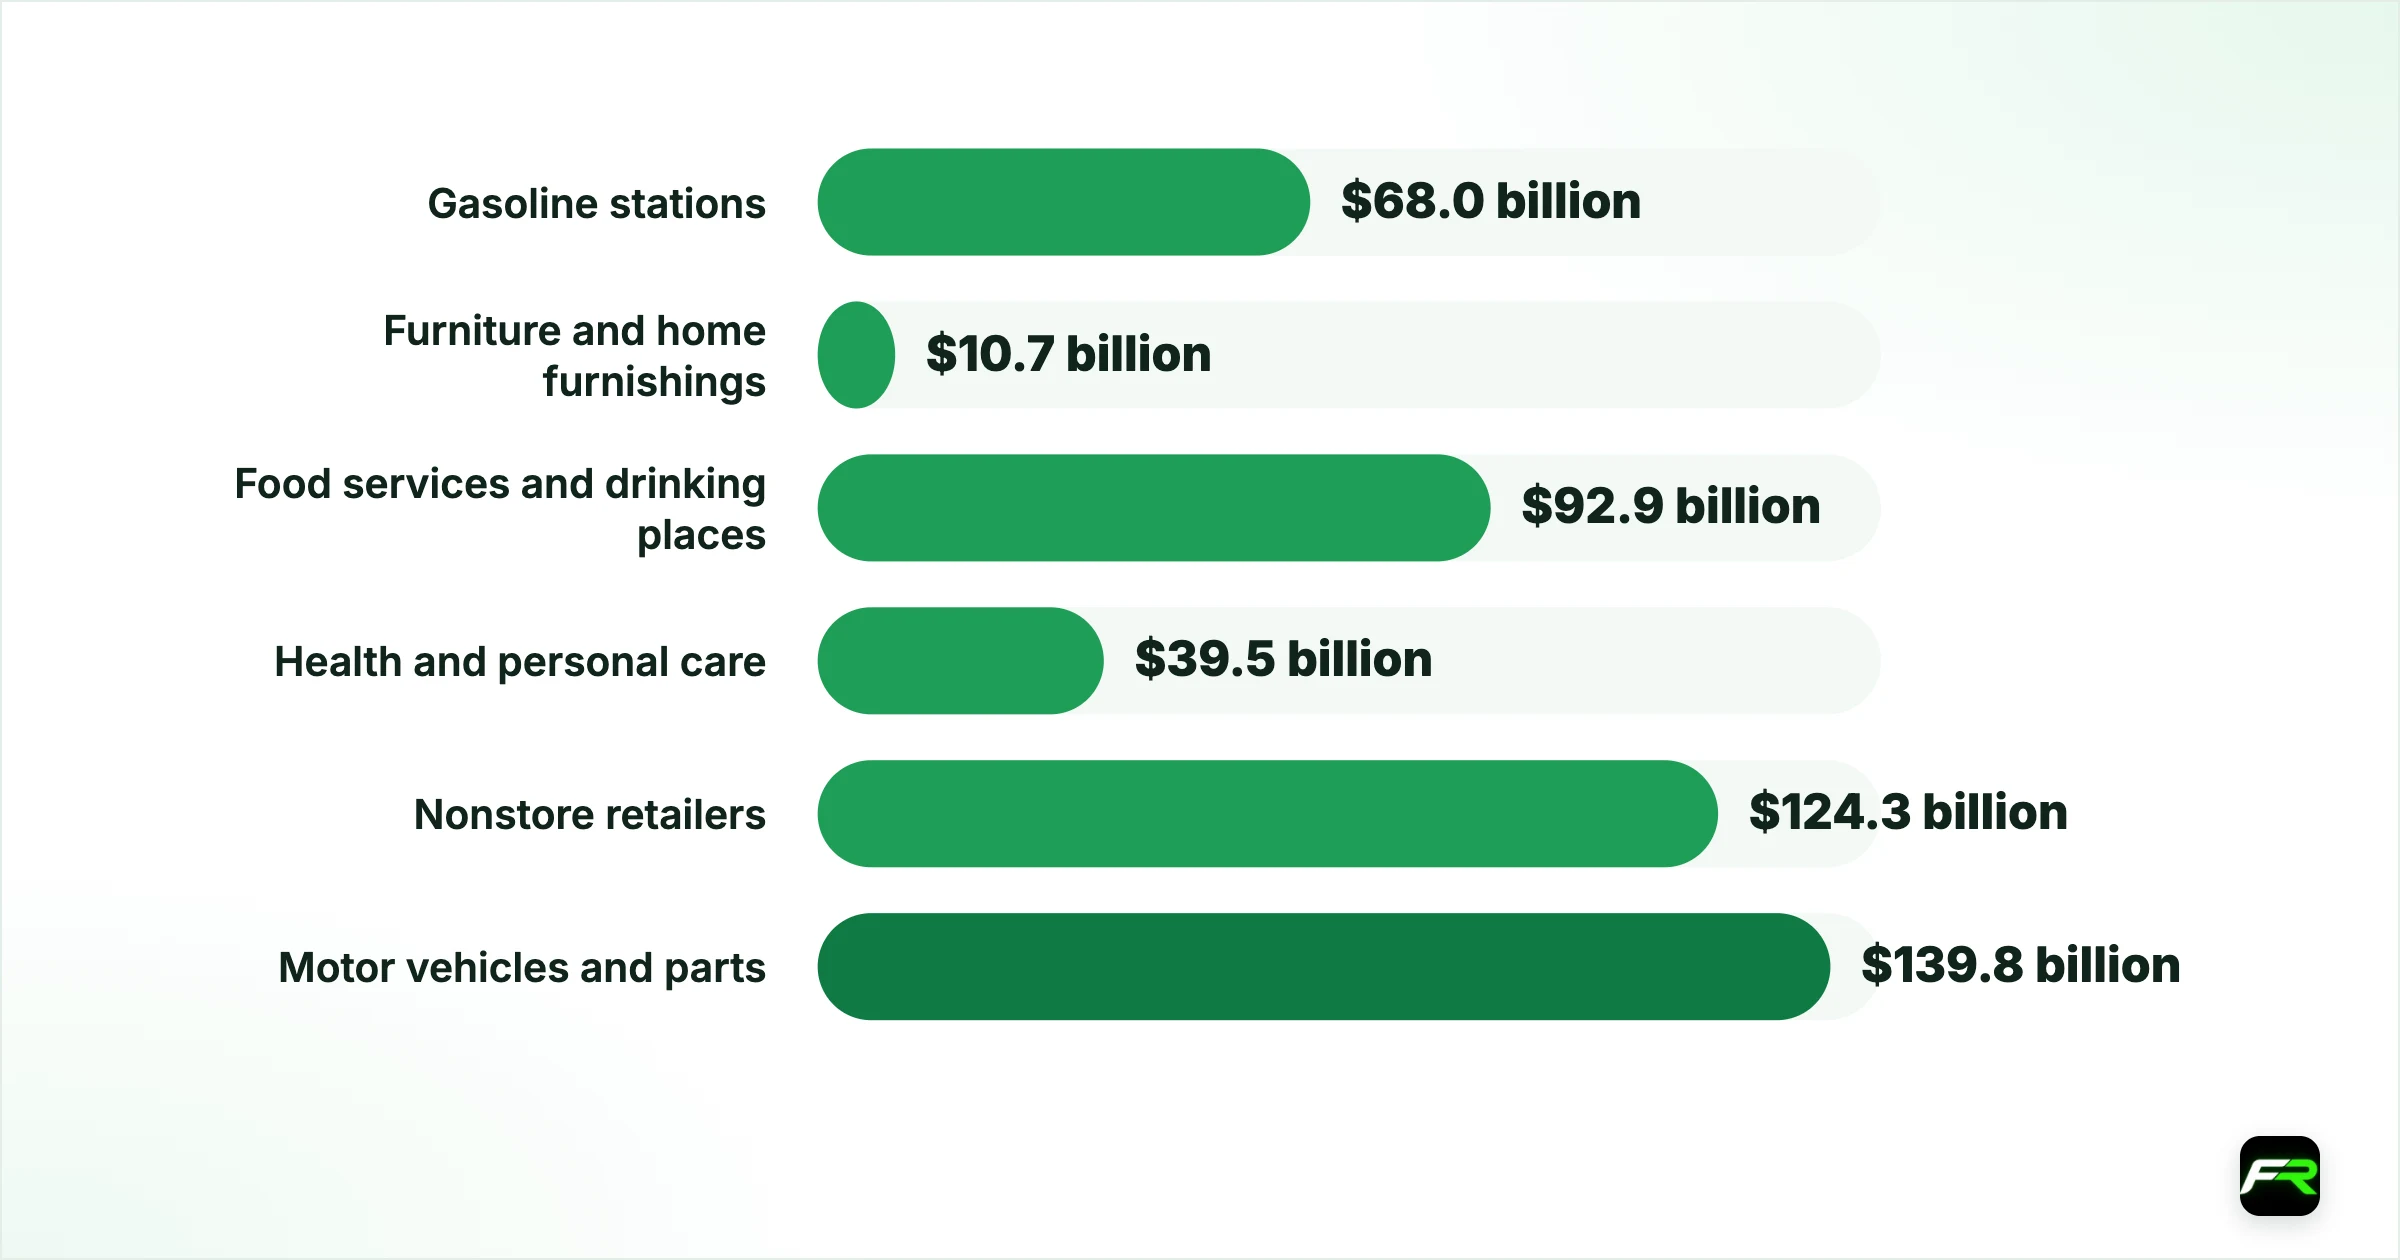
The Census Bureau's Table 1 shows the spread across store types. We compared the seasonally adjusted September advance estimate for each line with the August figure. Fuel stands out, and restaurants and bars had a decent month, but several store groups sold less than in August.
| Store type | September sales | Change from August |
|---|---|---|
| Gasoline stations | $68.0 billion | +6.4% |
| Furniture and home furnishings | $10.7 billion | +1.3% |
| Food services and drinking places | $92.9 billion | +1.1% |
| Health and personal care | $39.5 billion | +0.7% |
| Nonstore retailers (online) | $124.3 billion | +0.3% |
| Motor vehicles and parts | $139.8 billion | +0.2% |
| Building materials and garden | $44.1 billion | −0.6% |
| Miscellaneous store retailers | $15.8 billion | −3.0% |
Source: US Census Bureau, Advance Monthly Retail Trade report, 15 October 2026, Table 1 (adjusted). Percentage changes are FX Recap calculations from the published dollar figures.
General merchandise stores, which include warehouse clubs and supercenters, slipped about 0.1%, and clothing stores were flat. Sporting goods, hobby and book stores fell about 0.5%. Grocery and beverage stores rose 0.4%, roughly in line with food prices. Online retailers grew 0.3% on the month, a slower pace than their 8.2% gain over the year.
Economists often look at a narrower measure that leaves out autos, gasoline, building materials and restaurants, because it feeds directly into the government's estimate of consumer spending in GDP. The Census Bureau does not publish that series, but by our calculation from Table 1 it rose only about 0.1% in September. That is a weak result in a month when prices rose 0.6%.
How reliable the advance estimate is
The advance report is an early read, built from a sample of about 4,800 firms that is weighted to represent more than three million retail and food businesses. The Census Bureau gives each estimate a margin of error. September's 0.8% rise carries a range of plus or minus 0.4%, which makes it statistically significant, but the 0.2% gain excluding autos and gasoline does not clear that bar.
Revisions can be large. August's gain was first reported at 1.1% and now stands at 1.3%, with a much tighter margin of plus or minus 0.1%. Over the third quarter as a whole, sales were 5.5% higher than a year earlier. The Census Bureau also revised its monthly series on 28 September to reflect its annual surveys, so comparisons with older published figures may not line up exactly.
Why fuel is flattering the headline
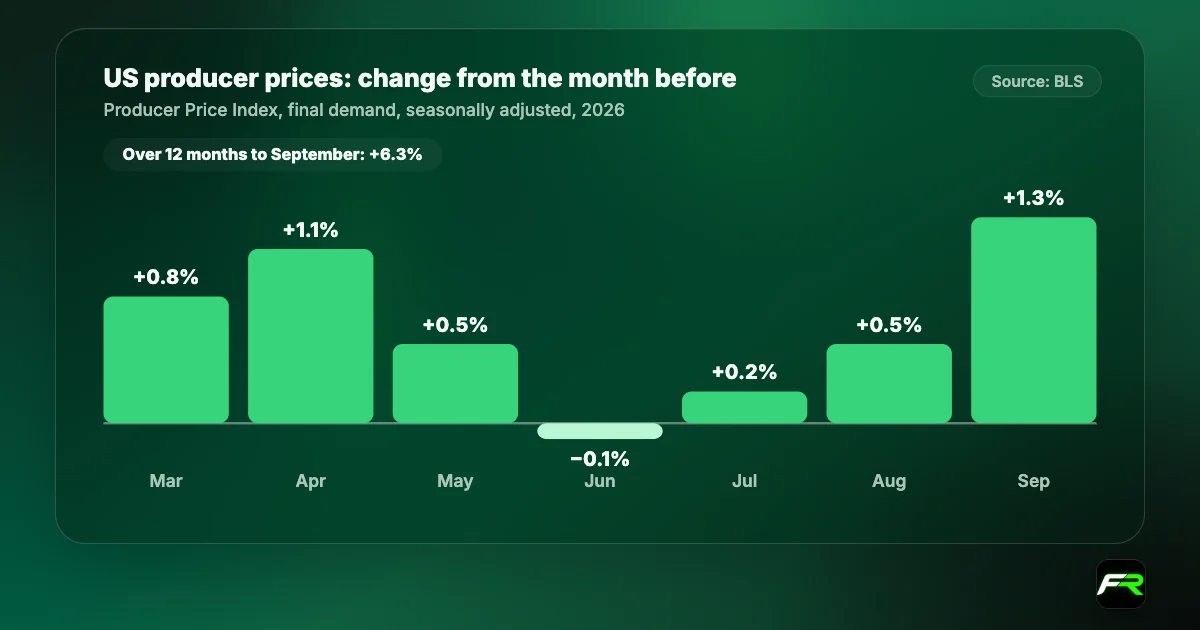
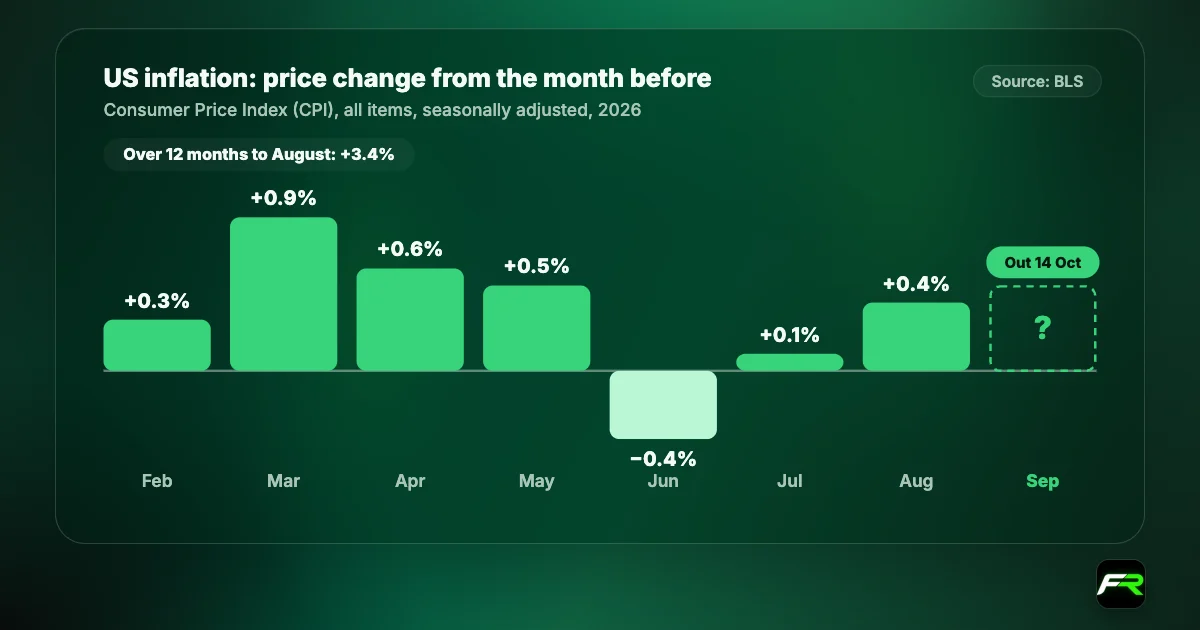
Gas station sales have risen about 28% from September 2025, by our calculation, matching what the inflation data show. The Bureau of Labor Statistics reported on Wednesday that gasoline prices rose 9.1% in September and 34.2% over the year. On Thursday it said producer-level gasoline prices jumped 20.3% in the month. When fuel costs that much more, households pay more at the pump without buying more fuel, and the receipts show up as higher retail sales.
Excluding motor vehicles and fuel, sales are up 5.0% from a year ago. With consumer inflation at 3.7%, that still leaves some real growth over the year, but the monthly trend has slowed sharply. Restaurant spending held up best: food services and drinking places were about 7.0% higher than a year earlier.
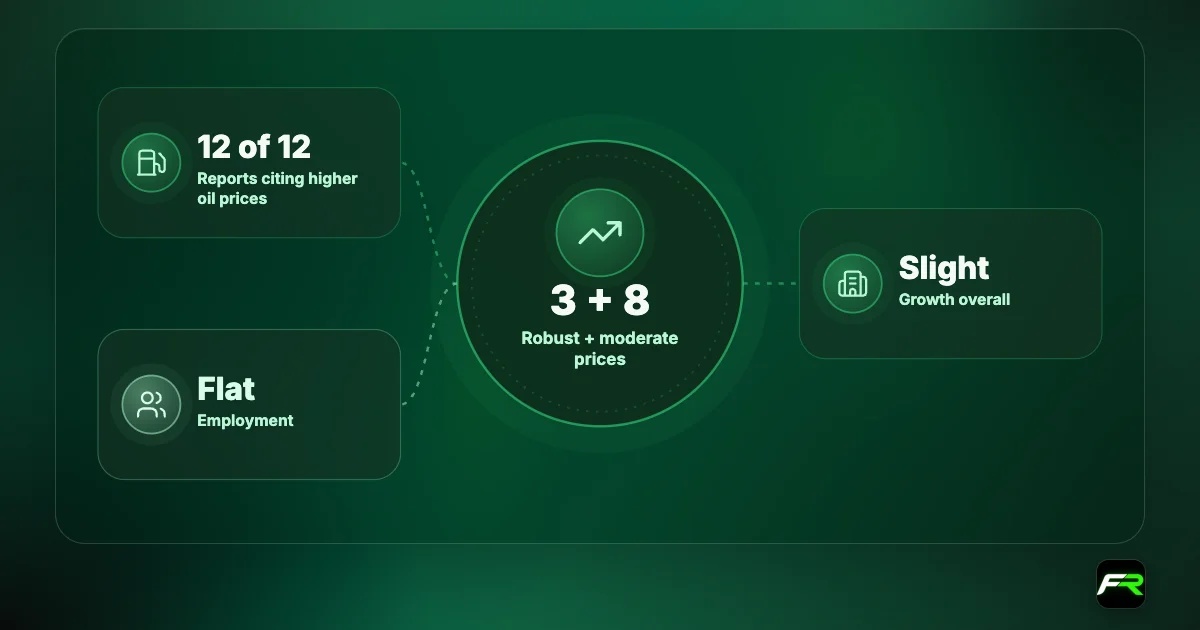
The Federal Reserve's Beige Book, published on 14 October, said much the same in words. Most districts reported little or no change in consumer spending, more than half said spending was driven by high-income households, and some retailers saw lower-income customers being more careful. Our Beige Book story covers the district detail.
What the report means for the dollar
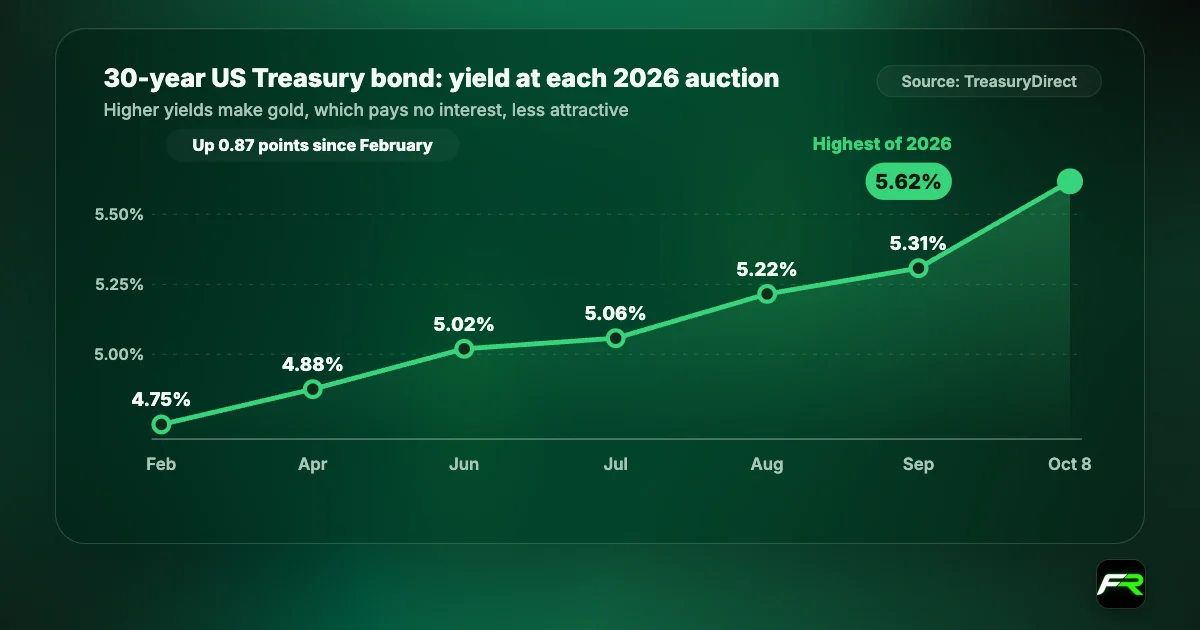
Retail sales landed at 12:30 UTC on Thursday, at the same moment as the much hotter producer price report. That timing makes it hard to separate the effect of each, and you should be wary of any account that claims to. What can be measured is the result: the dollar index rose to about 102.26 in the release hour, then fell below 102 within the hour, and ended the UTC day near 102.05, slightly lower than it started. US Treasury data show the 10-year yield fell to 5.10% from 5.19%.
Our reading is that soft spending outside fuel gave bond buyers a reason to look past the inflation numbers. If high fuel prices are squeezing households, demand may slow on its own, and the Fed may need to do less. That idea weighs on the dollar, because the currency's strength this year has rested on the gap between US yields and those elsewhere. One month of data does not make a trend, though, and the August figure was revised up, not down.
For EUR/USD, which closed Thursday at 1.1216 and traded near 1.1221 early on Friday, the next test is the Fed decision on 28 October. For USD/JPY, near 157.97, falling US yields are a headwind, although the pair has held above 157.50 all week.
How traders can use this report
Retail sales is one of the most-watched US releases, but the headline alone can mislead in a month like this. A few habits help.
- Read the line that excludes autos and gasoline before you react. In September it told a different story from the 0.8% headline.
- Compare sales growth with the CPI for the same month. Retail figures are in dollars, not volumes, so high inflation inflates them.
- Expect two releases at once to produce messy price action. On Thursday, PPI and retail sales came out together, and the first move reversed within an hour.
- Note the next date: October retail sales are due on 17 November, according to the Census Bureau. Add it to your economic calendar.
- Keep each trade small with the position size calculator; a 1% to 2% risk limit protects you from release-day whipsaws.
Say you sold USD/JPY at 158.10 in the release hour, expecting weak spending to pull US yields lower, with a stop at 158.60. That is 50 pips of risk, about $32 on a mini lot of 10,000 units at current prices. The pair fell to 157.54 in the following hour, then closed the day at 158.13. A trader who took profit at 157.60 gained about $32; one who held for a bigger move ended the day with a small loss.
For today's levels, see our daily EUR/USD analysis and USD/JPY analysis. The producer price report from the same morning is covered in our PPI story.
Spreads and slippage rise sharply around major data releases. Leverage magnifies losses as well as gains, so trade only with money you can afford to lose.
Retail sales figures and the next release date are from the US Census Bureau's advance monthly report. Category changes and the narrow core measure are FX Recap calculations from the Bureau's Table 1. Inflation data is from the US Bureau of Labor Statistics and yields are from the US Treasury. Currency levels are market data built from hourly bars. The reading of what the report means for the dollar is FX Recap's own. This is news, not investment advice.
Frequently asked
What were US retail sales in September 2026?
Retail and food services sales rose 0.8% to $745.0 billion in September and were 6.3% higher than a year earlier, according to the Census Bureau's advance estimate. August was revised up to a 1.3% gain.
What were retail sales excluding autos and gas?
Sales excluding motor vehicles and gasoline stations rose 0.2% in September. The Census Bureau says that change is not statistically different from zero.
Why did gas station sales rise so much?
Fuel prices jumped. The BLS reported gasoline prices up 9.1% in September at the consumer level, so receipts at gas stations rose about 6.4% without people buying more fuel.
When is the next US retail sales report?
The Census Bureau will publish October retail sales on 17 November 2026 at 8:30 a.m. Eastern time.
Sources: US Census Bureau: Advance Monthly Retail Trade report, September 2026 · US Bureau of Labor Statistics: Consumer Price Index, September 2026 · US Treasury: daily par yield curve rates · Federal Reserve: Beige Book, October 2026
The team behind this guide
Researched, checked and approved by five forex specialists
Every guide is written, fact-checked and edited before it goes live, and updated when the facts change. Spotted an error? Tell us.