IC Markets

 3:09
 2:39
 2:10
 2:18
 3:43
 8:42





































US Economy Grew 3.4% in the Third Quarter as PCE Inflation Rose to 3.6% in September
Growth beat the second quarter's 2.2%, but monthly prices rose 0.5% and real spending stalled in September, a mixed signal for the Fed.
 WriterAbir KhanWriterWrites the guides · checks every figure against primary sources View profileAbout Abir →

 Market analysisTanbir Habib RiyadForex & Crypto AnalystForex and crypto analyst · technical and fundamental analysis View profileAbout Tanbir →

 Fact-checking & riskJannatul FerdaushFact-Checker & Risk AnalystFact-checks every figure · risk analysis · Applied Statistics, University of Dhaka View profileAbout Jannatul →

 Trading reviewJowel RanaCo-Founder & Forex TraderCo-founder · forex trader · reviews guides from a trader's view View profileAbout Jowel →

 Final approvalRanjan NiskrityFounder, Owner & Forex TraderFounder and owner · forex trader · signs off every guide View profileAbout Ranjan →

The US economy grew at an annual rate of 3.4% in the third quarter of 2026, the Bureau of Economic Analysis said on Thursday 29 October in its first estimate. That is faster than the 2.2% pace of the second quarter. At the same time, the BEA's separate September report showed the personal consumption expenditures price index, the Federal Reserve's preferred inflation gauge, up 3.6% from a year earlier.
Both reports came out at 08:30 New York time, 12:30 UTC, a day after the Fed held rates with two officials voting for a rise. Taken together, they describe an economy that is still growing quickly while inflation runs well above the Fed's 2% goal. That mix supports the case the two dissenters made, although the details of the September data were softer than the headline growth figure.
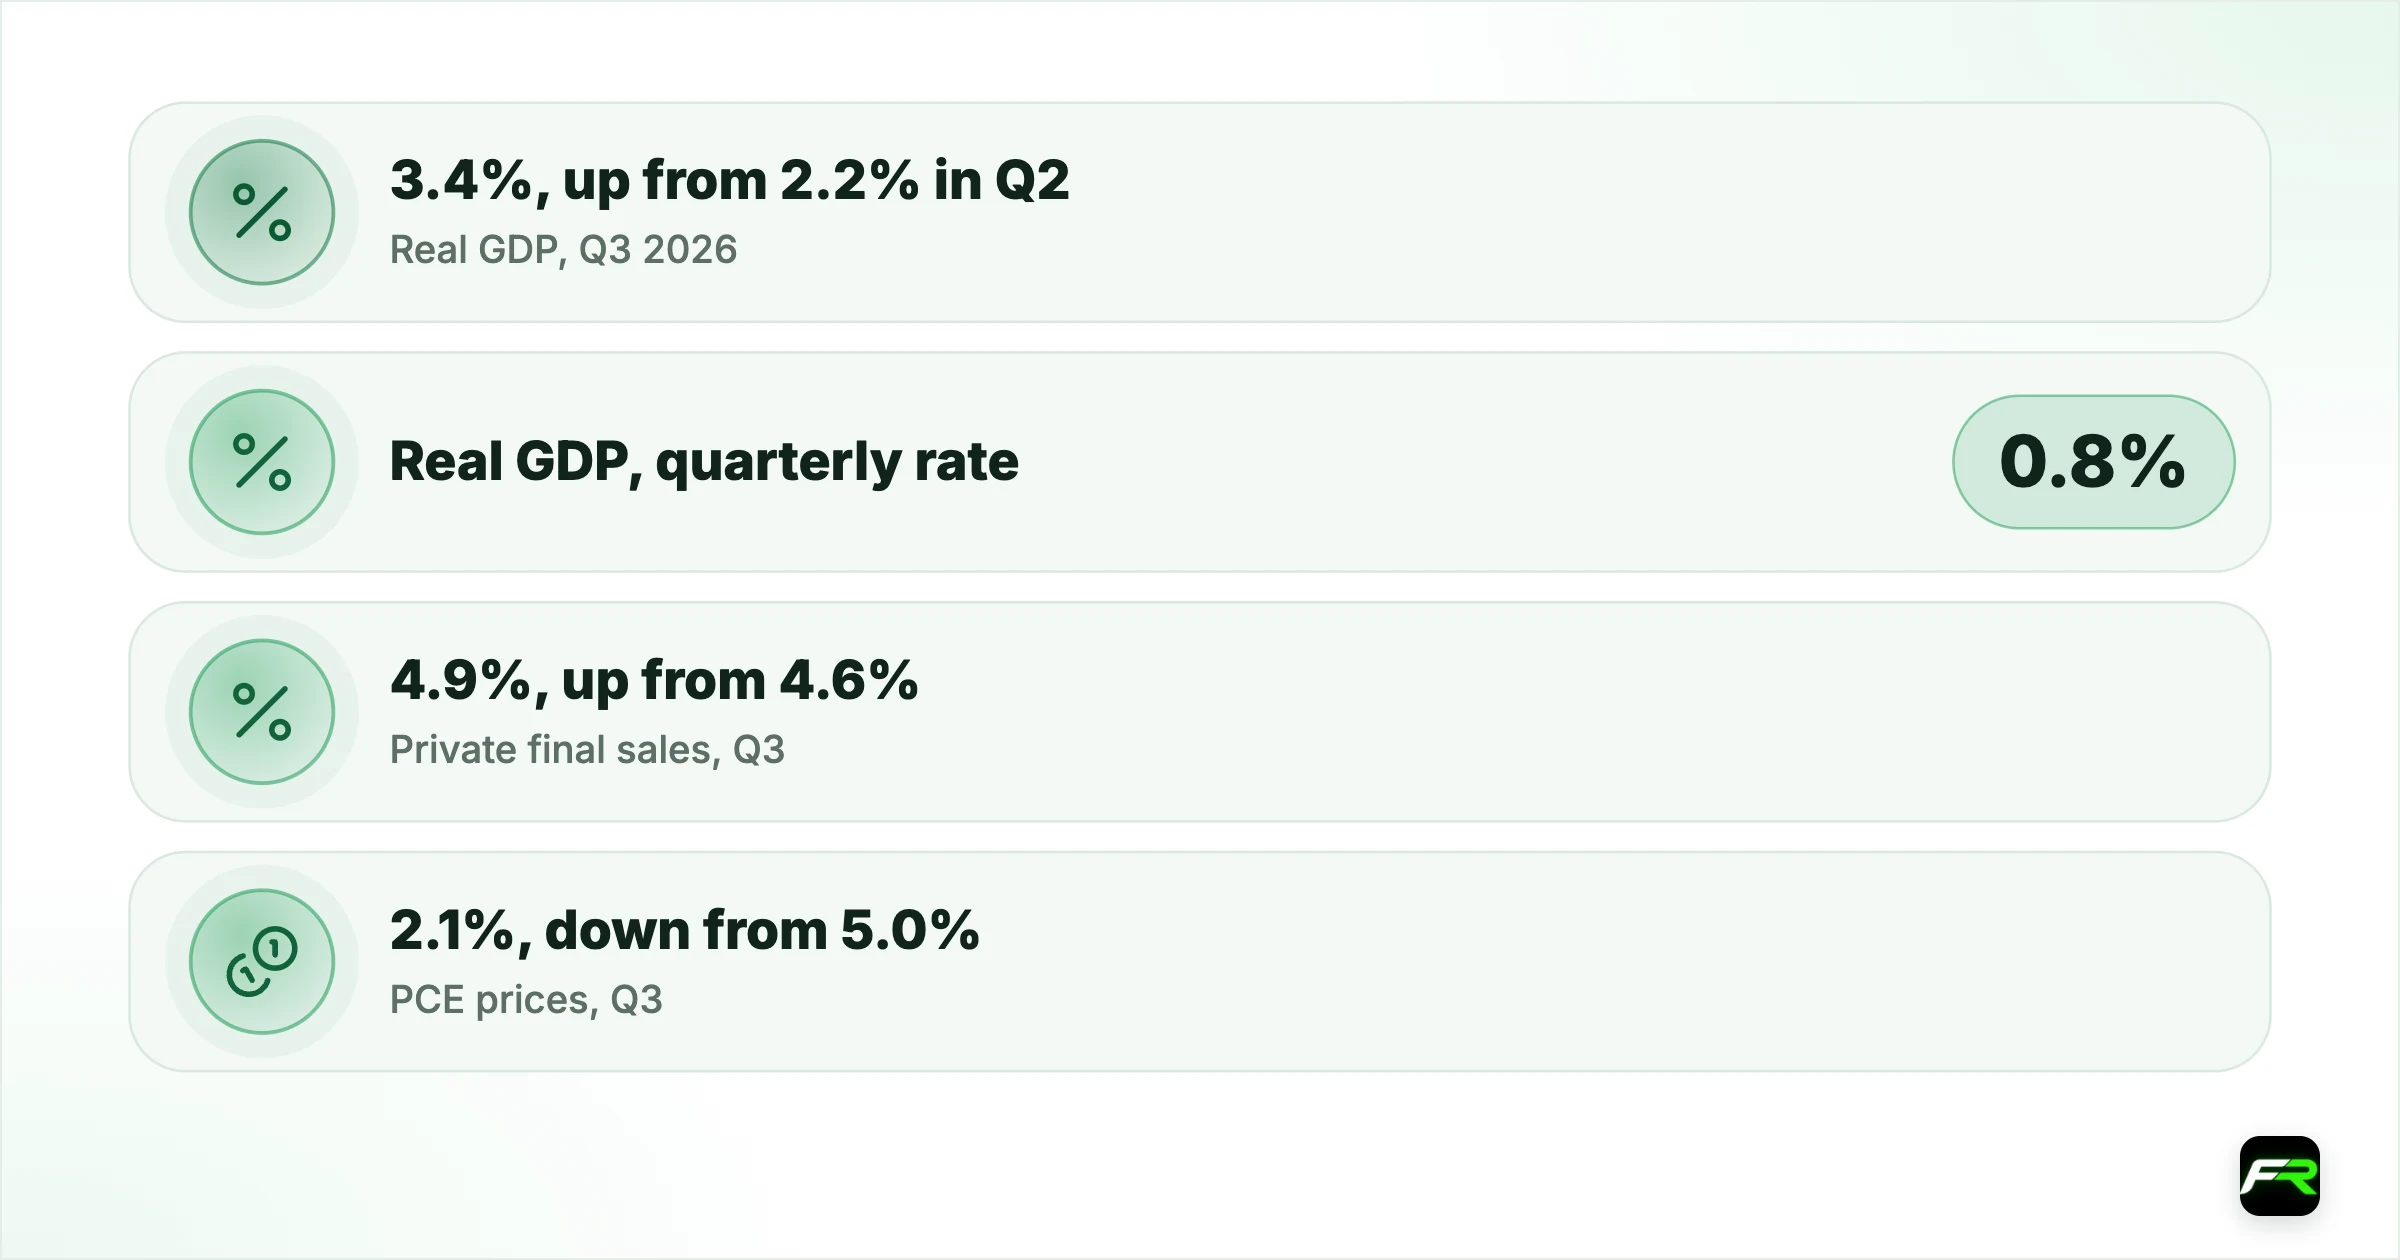
| Real GDP, Q3 2026 (annual rate) | 3.4%, up from 2.2% in Q2 |
|---|---|
| Real GDP, quarterly rate | 0.8% |
| Private final sales, Q3 | 4.9%, up from 4.6% |
| PCE prices, Q3 (annual rate) | 2.1%, down from 5.0% |
| PCE prices, September (year on year) | 3.6% |
| Core PCE, September (year on year) | 3.1% |
| PCE prices, September (month on month) | 0.5%; core 0.3% |
| Personal saving rate, September | 3.8% |
What drove third-quarter growth
Investment, consumer spending and government spending all rose, the BEA said, partly offset by a fall in exports. Imports, which are subtracted when GDP is calculated, increased. Within investment, the gains came mainly from inventories and equipment, led by information processing equipment such as computers. Consumer spending rose on both services and goods, with health care and restaurants leading services.
Government spending had an unusual twist. Federal nondefense spending rose mainly because the government sold less crude oil from the Strategic Petroleum Reserve than in the second quarter. Those sales are deducted from government consumption, so smaller sales show up as higher spending, although the BEA notes there is no direct effect on GDP overall because the oil appears elsewhere in the accounts.
A cleaner measure of demand points the same way. Real final sales to private domestic purchasers, which adds consumer spending and business fixed investment and leaves out trade, inventories and government, grew 4.9% after 4.6% in the second quarter. Fed officials watch that figure because it strips out the most volatile pieces, and a reading near 5% is strong by any standard.
This is an advance estimate built on incomplete data, and it will be revised. The BEA publishes its second estimate, with corporate profits, on 25 November.
PCE inflation: lower for the quarter, higher in September
The two inflation readings can look contradictory. For the third quarter as a whole, PCE prices rose at an annual rate of 2.1%, down from 5.0% in the second quarter, and core PCE, which excludes food and energy, rose at 2.5% after 3.3%. That is a quarter-on-quarter rate, annualised, so it shows that price growth slowed in the summer compared with the spring.
September alone was firmer. The PCE price index rose 0.5% from August, after 0.3% the month before, and core prices rose 0.3%. From a year earlier, headline PCE inflation was 3.6% and core was 3.1%. A month ago, the BEA's August report had put those annual rates at 3.4% and 3.0%. The headline rate rose faster than the core rate, which points to food and energy; the Fed's 28 October statement had already flagged higher energy prices.
For the Fed, the monthly figures matter more right now than the quarterly average, because they show where inflation is heading into the fourth quarter. A 0.5% monthly rise, if repeated, would be far above any pace consistent with 2% inflation.
Spending stalled in real terms
The softer part of the release was household demand in September. Consumer spending rose $113.1 billion, or 0.5%, in current dollars, with $35.1 billion more on goods and $78.1 billion more on services. Once prices are taken out, real spending rose $2.6 billion, less than 0.1%, after a 0.5% rise in August.
Incomes were also squeezed. Personal income grew 0.2% and disposable income grew 0.2%, but real disposable income, after inflation, fell 0.3%. The personal saving rate was 3.8%. If prices keep rising faster than pay, households may have to cut back, which could slow growth later in the year even after a strong third quarter.
What the data means for the Fed in December
Fed officials meet next on 9 December, and these releases are the first big pieces of evidence since they paused. Two of the three signals point toward another rise. Growth sped up to 3.4% from 2.2%, and the monthly inflation figures moved the wrong way. Chair Kevin Warsh had already said on 28 October that inflation “is too high” and that the third quarter “appears to have brought an even more rapid advance,” so Thursday's growth figure confirmed what he expected rather than surprising him.
Spending is the counterweight. Real consumer spending was flat in September and real disposable income fell, which is often how a slowdown starts. A central bank that raised rates as recently as September may prefer to see whether that weakness spreads before adding a third rise, especially as higher bond yields are already making borrowing dearer for households and firms.
Between now and December, the Fed will see at least one more jobs report and one more consumer price release, along with the BEA's October income and spending figures. Each one can shift market pricing, and the dollar usually moves with those shifts.
How yields and the dollar reacted
Treasury yields fell on the day. According to the US Treasury's daily par yield curve, the 2-year yield dropped to 4.61% on 29 October from 4.67% the day before, and the 10-year to 4.98% from 5.05%. The 30-year fell to 5.32% from 5.37%. Lower yields after a strong growth number may suggest that bond investors focused on the weak real spending and income figures, and on the slower quarterly inflation rate.
The ECB's euro reference rate for EUR/USD was 1.1130 on Thursday, set at about 13:15 UTC, after the US data and around the time of the ECB's own decision. That was the lowest reference rate of 2026 so far. Our ECB decision story covers the euro side of that move.
What it means for traders
Strong growth with firm monthly inflation keeps a December Fed rise in play, but stalling real spending gives officials a reason to wait. That leaves the dollar sensitive to each new data point. Things to watch next:
- The October jobs report from the Bureau of Labor Statistics, the next big test of whether the economy is cooling.
- The October CPI release, which will show whether September's jump in prices carried on.
- Fed speeches, especially from Lisa Cook and Beth Hammack, who voted for a rise on 28 October. Our Fed decision story has the background.
- The BEA's October income and spending report and second GDP estimate, both on 25 November.
- The Fed's 9 December decision, which comes with new projections.
Suppose you sell EUR/USD at 1.1130, expecting strong US growth to keep the dollar firm, with a stop at 1.1185, 55 pips away. With a $3,000 account and a 1% risk limit, you can lose $30, so the trade size is about 5,500 units, where one pip is worth about $0.55. If the next jobs report disappoints, the dollar could weaken quickly, so plan your exit before the release. The <a href="/position-size-calculator">position size calculator</a> works this out for any pair.
Daily levels for the main pairs are on our EUR/USD analysis and USD/JPY analysis pages. Release times in your own time zone are on the economic calendar.
Major US data releases can move currencies sharply in seconds, and prices can gap past stop orders. Leverage magnifies losses as well as gains, so trade only with money you can afford to lose.
GDP figures come from the BEA's advance estimate for the third quarter of 2026, and income, spending and PCE price figures from its September 2026 personal income and outlays release, both published on 29 October 2026. Yields are from the US Treasury's daily par yield curve, and the exchange rate is an ECB euro reference rate. This is news, not investment advice.
Frequently asked
How fast did the US economy grow in the third quarter of 2026?
Real GDP grew at an annual rate of 3.4% in the third quarter of 2026, according to the BEA's advance estimate of 29 October. Growth was 2.2% in the second quarter.
What was PCE inflation in September 2026?
The PCE price index rose 3.6% from a year earlier and 0.5% from August. Core PCE, which excludes food and energy, rose 3.1% from a year earlier and 0.3% on the month.
Why did PCE inflation fall for the quarter but rise in September?
The quarterly figure, 2.1% at an annual rate, compares average prices in July to September with April to June. The September figure compares one month with a year earlier, and monthly prices picked up as energy costs rose.
When is the next US GDP estimate?
The BEA publishes its second estimate of third-quarter GDP, with corporate profits, on 25 November 2026, the same day as October's income and spending data.
Sources: BEA: GDP (Advance Estimate), 3rd Quarter 2026 · BEA: Personal Income and Outlays, September 2026 · US Treasury: daily par yield curve rates · European Central Bank: euro foreign exchange reference rates · BEA: Personal Income and Outlays, August 2026
The team behind this guide
Researched, checked and approved by five forex specialists
Every guide is written, fact-checked and edited before it goes live, and updated when the facts change. Spotted an error? Tell us.