IC Markets




































US Inflation Rises to 3.7% on Gasoline, but the Dollar Gives Back Its Jump
September CPI rose 0.6% as gasoline jumped 9.1%. The dollar index spiked to 102.9, then gave it all back while core inflation held at 0.3%.
 WriterAbir KhanWriterWrites the guides · checks every figure against primary sources View profileAbout Abir →
 Market analysisTanbir Habib RiyadForex & Crypto AnalystForex and crypto analyst · technical and fundamental analysis View profileAbout Tanbir →
 Fact-checking & riskJannatul FerdaushFact-Checker & Risk AnalystFact-checks every figure · risk analysis · Applied Statistics, University of Dhaka View profileAbout Jannatul →
 Trading reviewJowel RanaCo-Founder & Forex TraderCo-founder · forex trader · reviews guides from a trader's view View profileAbout Jowel →
 Final approvalRanjan NiskrityFounder, Owner & Forex TraderFounder and owner · forex trader · signs off every guide View profileAbout Ranjan →
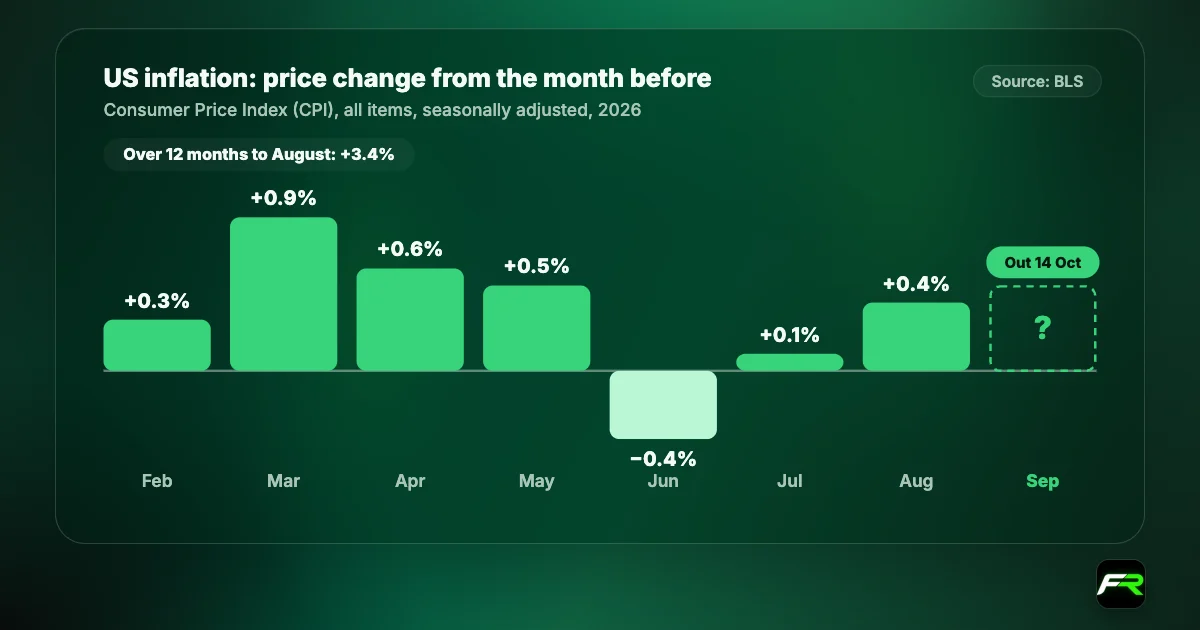
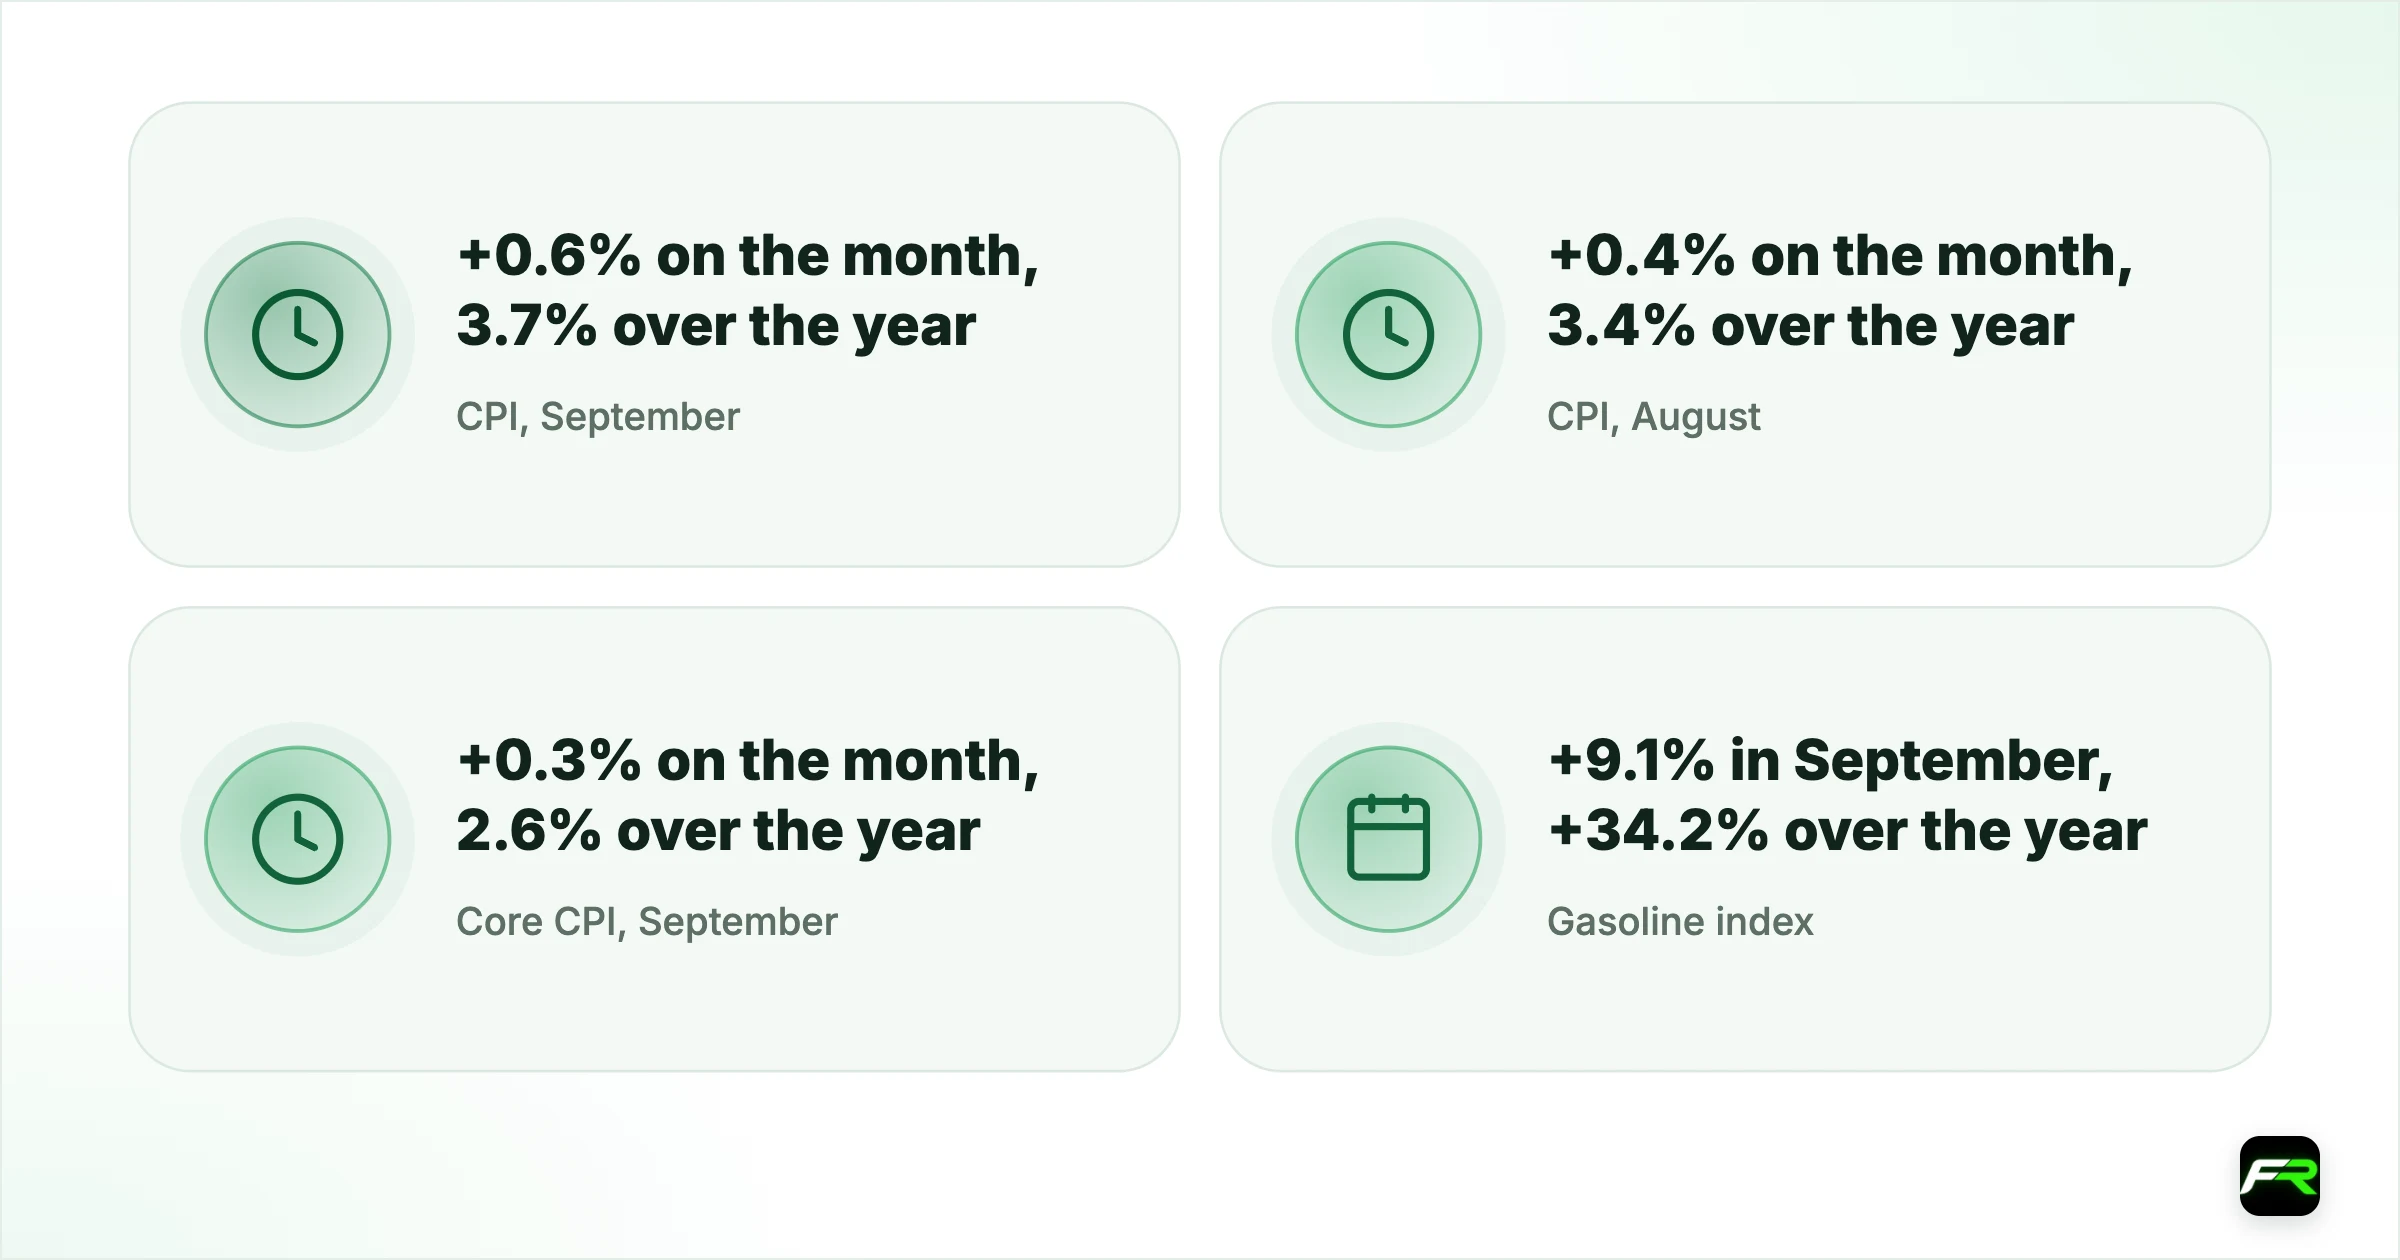
US consumer prices rose faster in September, and once again gasoline did most of the work. The Bureau of Labor Statistics said on Wednesday that its Consumer Price Index climbed 0.6% on the month after a 0.4% rise in August, lifting the annual rate to 3.7% from 3.4%. Gasoline prices jumped 9.1% in the month and accounted for over half of the overall increase.
Currency markets reacted in two stages. In the first minutes after the 12:30 UTC release, the dollar rallied hard: the dollar index rose from about 102.24 to 102.95 within a few hours and EUR/USD fell to 1.1117, its lowest level in at least a year. By the end of the US session, both moves had unwound. The index finished the UTC day near 102.21, below where it started, and the euro closed at 1.1198. In Asian trading on Thursday the dollar slipped further, with EUR/USD near 1.1232 at 03:05 UTC.
| CPI, September (BLS) | +0.6% on the month, 3.7% over the year |
|---|---|
| CPI, August (BLS) | +0.4% on the month, 3.4% over the year |
| Core CPI, September | +0.3% on the month, 2.6% over the year |
| Gasoline index | +9.1% in September, +34.2% over the year |
| Energy index | +5.2% in September, +20.4% over the year |
| Fed funds rate | 3.75%–4.00%; next decision 28 October |
| Next CPI report | October data on Tuesday 10 November |
What the September inflation report showed
Energy is the story behind the headline number. According to the BLS, the energy index rose 5.2% in September after a 2.1% gain in August, and it now stands 20.4% higher than a year ago. Gasoline is up 34.2% over 12 months and fuel oil 74.2%. Those are the costs households notice first, at the pump and on heating bills, and they explain why the all-items rate has climbed from 3.4% to 3.7% in a single month.
Food gave some relief. The food index was unchanged in September: prices for food at home fell 0.1%, led by lower beef and milk prices, while restaurant meals rose 0.2%. Over the year, grocery prices are up only 1.8%, well below the headline rate, which shows how concentrated the inflation shock is in fuel.
Core inflation, which strips out food and energy, rose 0.3% for a second month. Its annual rate edged up to 2.6% from 2.4%. Shelter, the largest piece of the core basket, increased 0.4% after 0.3% in August. Used cars and trucks rose 0.7%, and airline fares, recreation, education, medical care and apparel also moved higher. Communication was among the few categories that fell. A rise in airfares is a sign that fuel costs are starting to reach service prices, which is the spillover the Federal Reserve worries about most.
How the dollar and gold moved on the day
Hourly market data show how quickly the first reaction faded. The table compares the level just before the release with the extreme reached afterwards, the close of the UTC day and the price early on Thursday.
| Market | Before release (12:00 UTC) | Post-CPI extreme | Close 14 Oct | 15 Oct, about 03:00 UTC |
|---|---|---|---|---|
| Dollar index | 102.24 | 102.95 (high) | 102.21 | 101.96 |
| EUR/USD | 1.1197 | 1.1117 (low) | 1.1198 | 1.1232 |
| USD/JPY | 158.44 | 158.95 (high) | 157.98 | 157.74 |
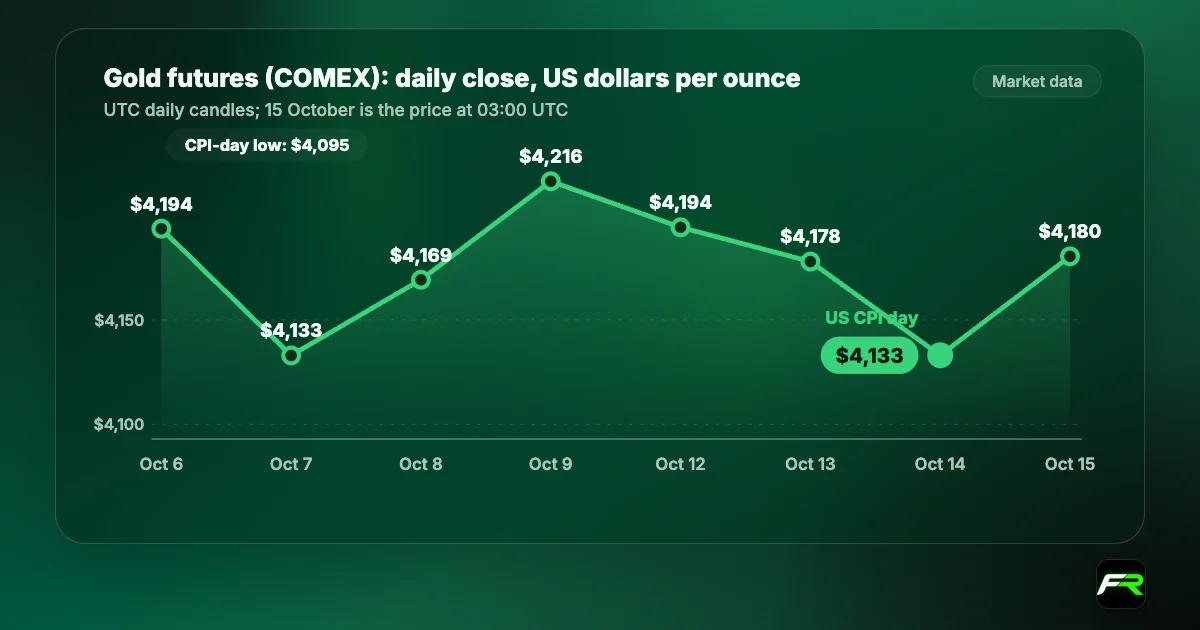
| Gold futures (COMEX) | $4,161.8 | $4,095.0 (low) | $4,133.1 | $4,180.4 |
UTC candles built from hourly market data; levels differ slightly between providers.
The dollar's high came during the London afternoon, two to three hours after the data. From there it drifted lower through the New York session, and the selling picked up in the last hours of US trading. USD/JPY traced the same arc: it spiked to 158.95, close to last month's 159.04 high, then fell almost a full yen to finish just below 158. Gold went the other way, dropping $67 from its pre-release level to $4,095 before buyers returned. By Thursday morning in Asia, futures had climbed back above $4,180, higher than before the report.
Why the dollar could not hold its gains
No single headline explains the reversal, and traders should be wary of anyone who claims one. Our reading is that the report mixed a hot headline with a steady core. The all-items jump was large, but it came almost entirely from fuel, and core prices rose at the same 0.3% pace as in August. Investors who had bought dollars ahead of the release on the fear of a broad price surge had less reason to keep holding them once the detail was clear.
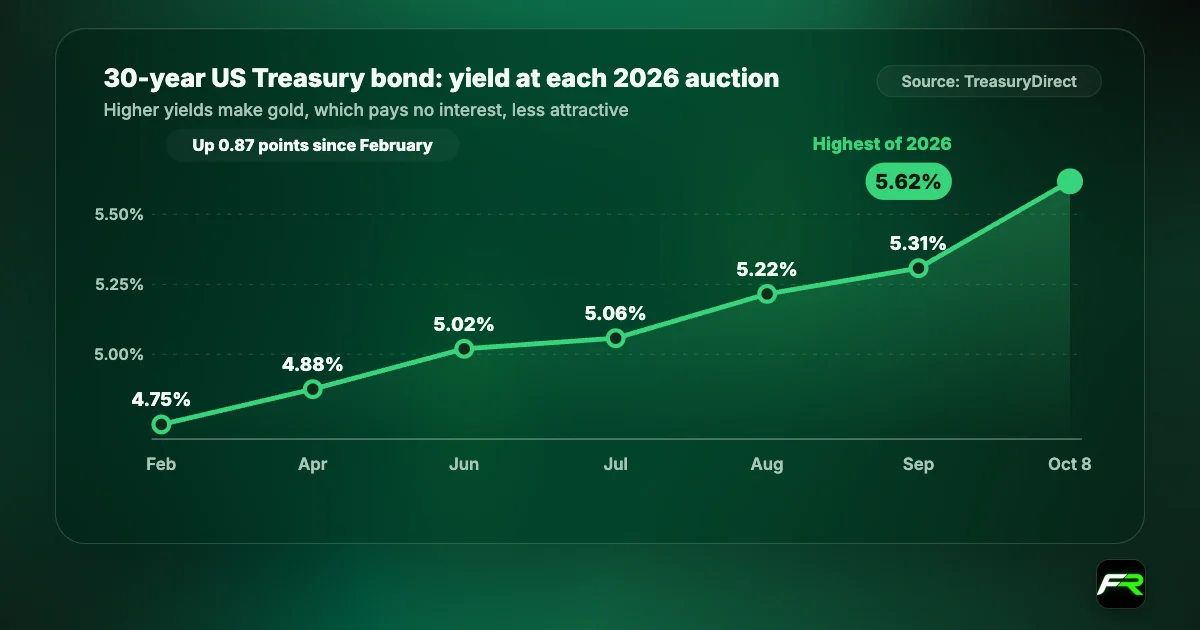
Treasury yields support that view. According to the US Treasury's daily yield curve, the 2-year yield rose to 4.82% on Wednesday from 4.79% on Tuesday, while the 10-year yield slipped to 5.19% from 5.21% and the 30-year fell to 5.52% from 5.56%. In other words, short-dated bonds, which track expectations for the Fed's next few moves, priced a little more tightening, but long-dated bonds rallied. Both the 10-year and 30-year closed at their lowest levels since 25 September. Long-dated yields have been the dollar's main support this autumn, so their slide took some of the shine off the greenback.
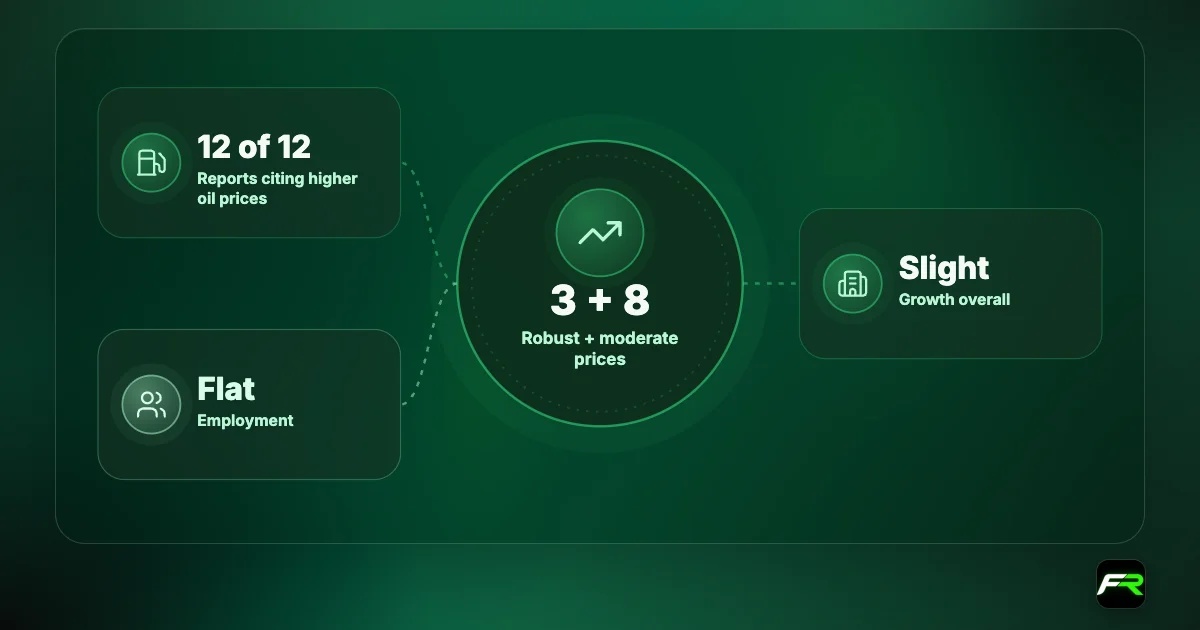
The Fed's Beige Book, published the same day, added to the mixed signals: it described price growth as moderate to robust but employment as little changed. Our Beige Book story covers what the 12 Reserve Banks reported.
What it means for the Fed on 28 October
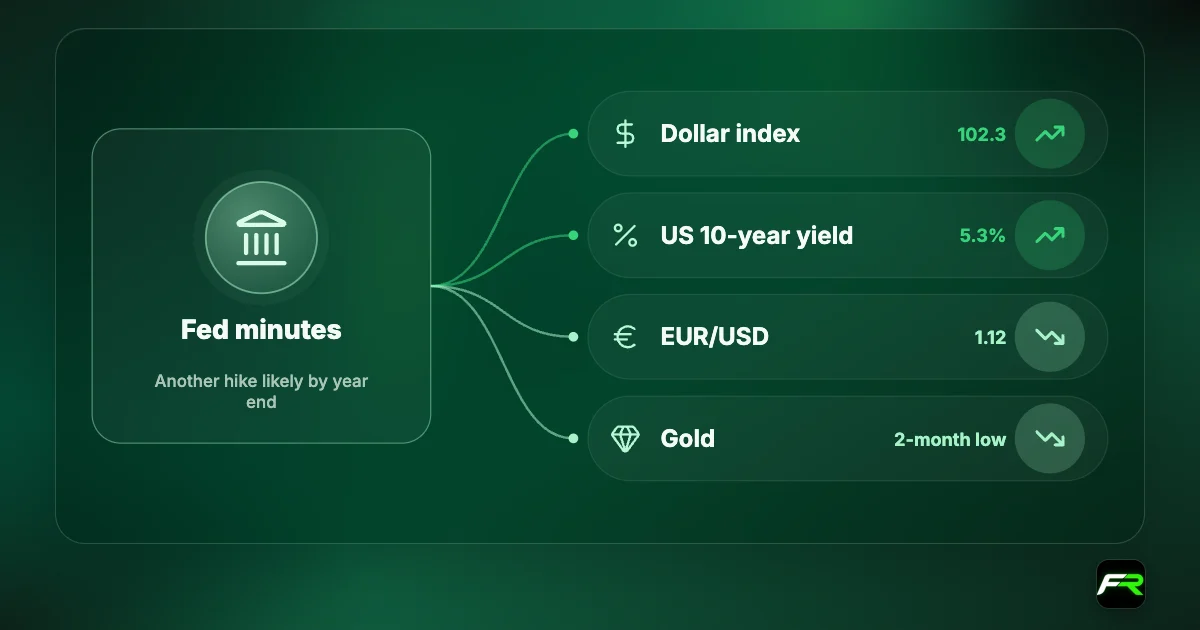
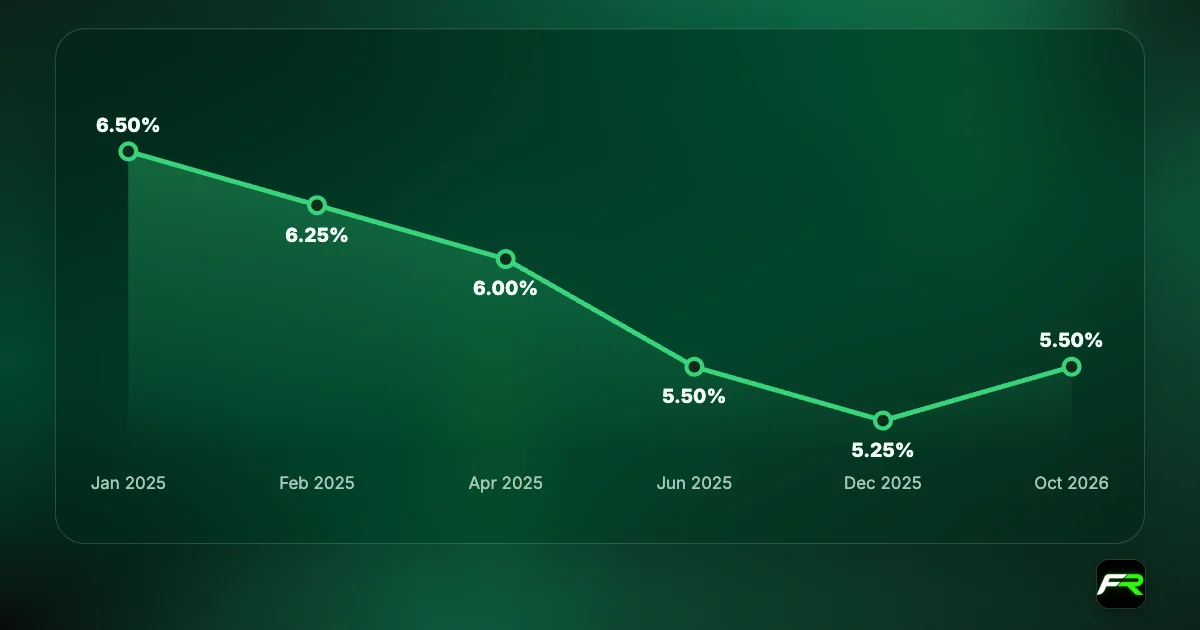
The Federal Reserve raised its target range by a quarter point to 3.75% to 4.00% on 16 September, and minutes of that meeting showed most officials expected another increase by the end of the year. Its policy committee meets next on 27 and 28 October, with the decision due on the 28th. September's CPI is the last consumer price report before that meeting: the October figures are not due until Tuesday 10 November, according to the BLS.
For policymakers, the report cuts both ways. A 3.7% headline rate is far above the Fed's 2% goal and rising, and the spread into airfares and other services is the kind of second-round effect officials have warned about. Against that, a 2.6% core rate is still close to target and has moved only slowly. A central bank that has already hiked once this cycle may prefer to wait for more evidence than to move again in October, though that is a judgement, not a certainty.
US producer prices for September are due today, Thursday, at 8:30 a.m. Eastern time, or 12:30 UTC. Producer prices often lead consumer prices by a few months, so another jump in energy-related costs would keep the pressure on.
How to trade the next two weeks
The reaction on Wednesday was a lesson in how data-day moves can reverse. Anyone who sold EUR/USD at 1.1130 chasing the first move was looking at a loss of about 100 pips by Thursday morning. Several practical points follow.
- Mark today's 12:30 UTC producer price release in your economic calendar; spreads can widen in the minutes around it.
- Wait for the first 15 to 30 minutes after a release before acting. Wednesday's dollar high came more than two hours after the data, and the low came hours later still.
- Watch the 10-year and 30-year Treasury yields beside EUR/USD and gold. On Wednesday, the long end of the curve was a better guide to the close than the headline CPI number.
- Keep risk per trade small with the position size calculator; one trade should not cost more than 1% to 2% of your account.
- Treat the 28 October Fed decision as the next big event risk for every dollar pair, and cut size into it.
Say you sold one mini lot (10,000 units) of EUR/USD at 1.1135 just after the CPI release, with a stop at 1.1185. That is about $50 at risk. The pair recovered through 1.1185 later in the session, so the stop closed the trade for a $50 loss, plus any slippage. A trader who waited for the dust to settle could instead have sold a bounce towards 1.1200 with a stop above 1.1250, the same $50 of risk, and avoided being caught by the reversal.
Our daily EUR/USD analysis, USD/JPY analysis and gold analysis carry today's levels and trade plans.
Spreads and slippage rise sharply around data releases. Leverage magnifies both, so size each trade by the money you can afford to lose.
Inflation figures and the next release date are from the US Bureau of Labor Statistics. Yields are from the US Treasury's daily par yield curve, and the rate decision and meeting dates are from the Federal Reserve. Currency, dollar index and gold levels are market data built from hourly bars and differ slightly between providers. The explanation of why the dollar faded is FX Recap's own reading. This is news, not investment advice.
Frequently asked
What was US inflation in September 2026?
Consumer prices rose 0.6% in September and 3.7% over the 12 months, up from 3.4% in August, according to the Bureau of Labor Statistics. Gasoline rose 9.1% in the month and accounted for over half of the increase.
What was core CPI in September 2026?
The index excluding food and energy rose 0.3% on the month, the same pace as in August. Over the year it rose 2.6%, up from 2.4%.
Why did the dollar fall after a hot CPI report?
The dollar first jumped, then gave back its gains. Core inflation was steady, and long-dated Treasury yields fell to their lowest since 25 September, which removed some of the dollar's support. That is our reading of the move; markets do not publish their reasons.
When is the next US CPI report?
The BLS will publish October consumer prices on Tuesday 10 November 2026 at 8:30 a.m. Eastern time. That is after the Fed's 27-28 October meeting.
Sources: US Bureau of Labor Statistics: Consumer Price Index, September 2026 · US Treasury: daily par yield curve rates · Federal Reserve: Beige Book, October 2026 · Federal Reserve: FOMC meeting calendar
The team behind this guide
Researched, checked and approved by five forex specialists
Every guide is written, fact-checked and edited before it goes live, and updated when the facts change. Spotted an error? Tell us.