IC Markets

 3:09
 2:39
 2:10
 2:18
 3:43
 8:42





































Euro Area Inflation Rises to 4.0% in October as Energy Prices Climb 20.8%
Eurostat's flash estimate shows the highest rate since the energy shock began, though core prices held at 2.5%. What it means for the ECB and EUR/USD.
 WriterAbir KhanWriterWrites the guides · checks every figure against primary sources View profileAbout Abir →

 Market analysisTanbir Habib RiyadForex & Crypto AnalystForex and crypto analyst · technical and fundamental analysis View profileAbout Tanbir →

 Fact-checking & riskJannatul FerdaushFact-Checker & Risk AnalystFact-checks every figure · risk analysis · Applied Statistics, University of Dhaka View profileAbout Jannatul →

 Trading reviewJowel RanaForex TraderForex trader · reviews guides from a trader's view View profileAbout Jowel →

 Final approvalRanjan N. MondolForex TraderForex trader · signs off every guide View profileAbout Ranjan →

Consumer prices in the euro area rose 4.0% in the twelve months to October, up from 3.8% in September, according to Eurostat's flash estimate published on Wednesday 4 November. Prices rose 0.4% in the month alone. A year ago the annual rate was 2.1%, so inflation has nearly doubled in twelve months.
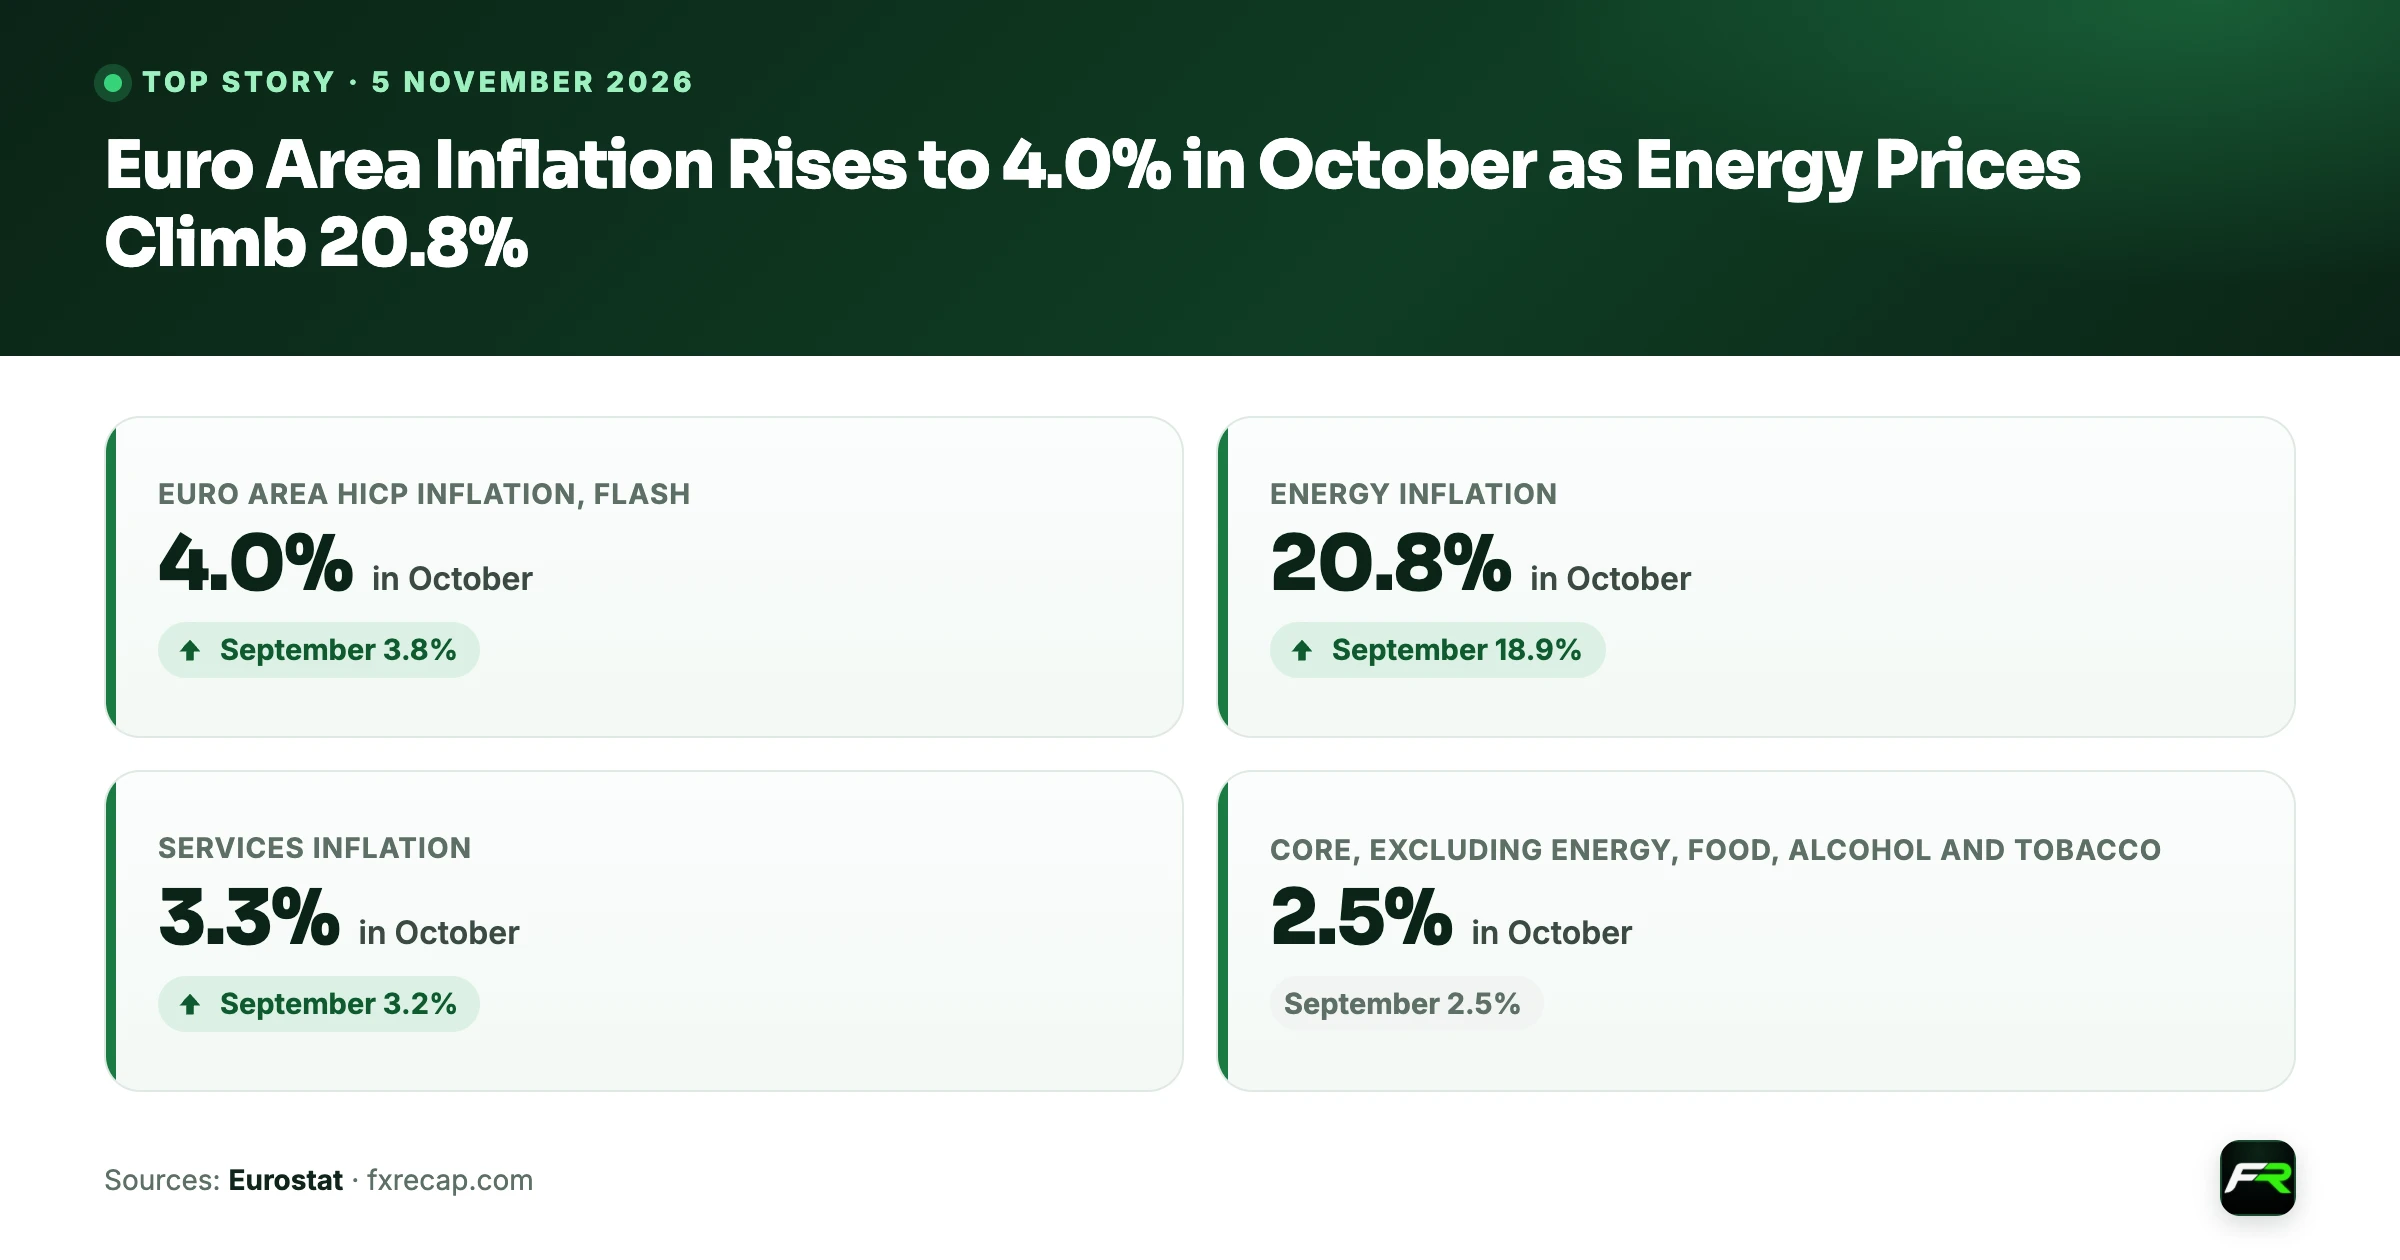
Energy did most of the work. Energy prices were 20.8% higher than a year earlier, up from 18.9% in September, and the rate has climbed every month since July. Underneath, the picture is calmer: inflation excluding energy, food, alcohol and tobacco, the core measure many traders follow, stayed at 2.5%.
For euro traders the release sharpens the question the European Central Bank left open in October, when it held the deposit rate at 2.50% after debating a rise. EUR/USD reacted firmly. The ECB's reference rate, set at about 13:15 UTC on the same day, was 1.1267, up from 1.1179 on Tuesday.
| Euro area HICP inflation, flash (Eurostat) | 4.0% in October (September 3.8%) |
|---|---|
| Energy inflation (Eurostat) | 20.8% in October (September 18.9%) |
| Services inflation (Eurostat) | 3.3% in October (September 3.2%) |
| Core, excluding energy, food, alcohol and tobacco (Eurostat) | 2.5% in October (September 2.5%) |
What drove inflation to 4.0%
Energy carries a weight of about 9% in the euro area basket, yet at a 20.8% annual rate it adds close to two percentage points to the headline figure by itself. That is why the gap between headline and core inflation has grown so wide. In October 2025 energy prices were falling, at -0.9%, so this year's comparison is also flattered by a low starting point.
Food prices picked up a little. Food, alcohol and tobacco rose 1.6% from 1.3%, and unprocessed food, the more volatile part, jumped to 4.6% from 4.0%. Non-energy industrial goods, such as clothes, cars and electronics, edged up to 1.2% from 1.1%. Services inflation, almost half the basket, rose to 3.3% from 3.2%.
Two details matter for what comes next. Services inflation at 3.3% is high for a central bank aiming at 2%, but it is no higher than a year ago (3.4% in October 2025), which suggests wages have not yet pushed service prices up. Goods inflation is rising slowly, consistent with firms passing on higher energy and transport costs with a lag. If that pass-through continues, core inflation could start to climb even if energy prices level off.
A second core measure tells the same story. Inflation excluding energy alone, which keeps food in, was 2.3% in October, unchanged from September and very close to where it stood in the spring. By that yardstick, prices outside the energy bill are rising only a little faster than the ECB's 2% target. The monthly 0.4% rise in the overall index is large for October, though, and a run of similar months would keep the annual rate near or above 4% into the new year even if energy inflation stopped rising.
Big differences between countries
The flash release covers every member, and the spread is wide. Italy's rate jumped to 5.6% from 4.2%, one of the largest monthly rises in the table, and Belgium reached 5.2%. Germany went the other way, slowing to 2.8% from 3.3% with prices falling 0.1% on the month. France rose to 3.8%.
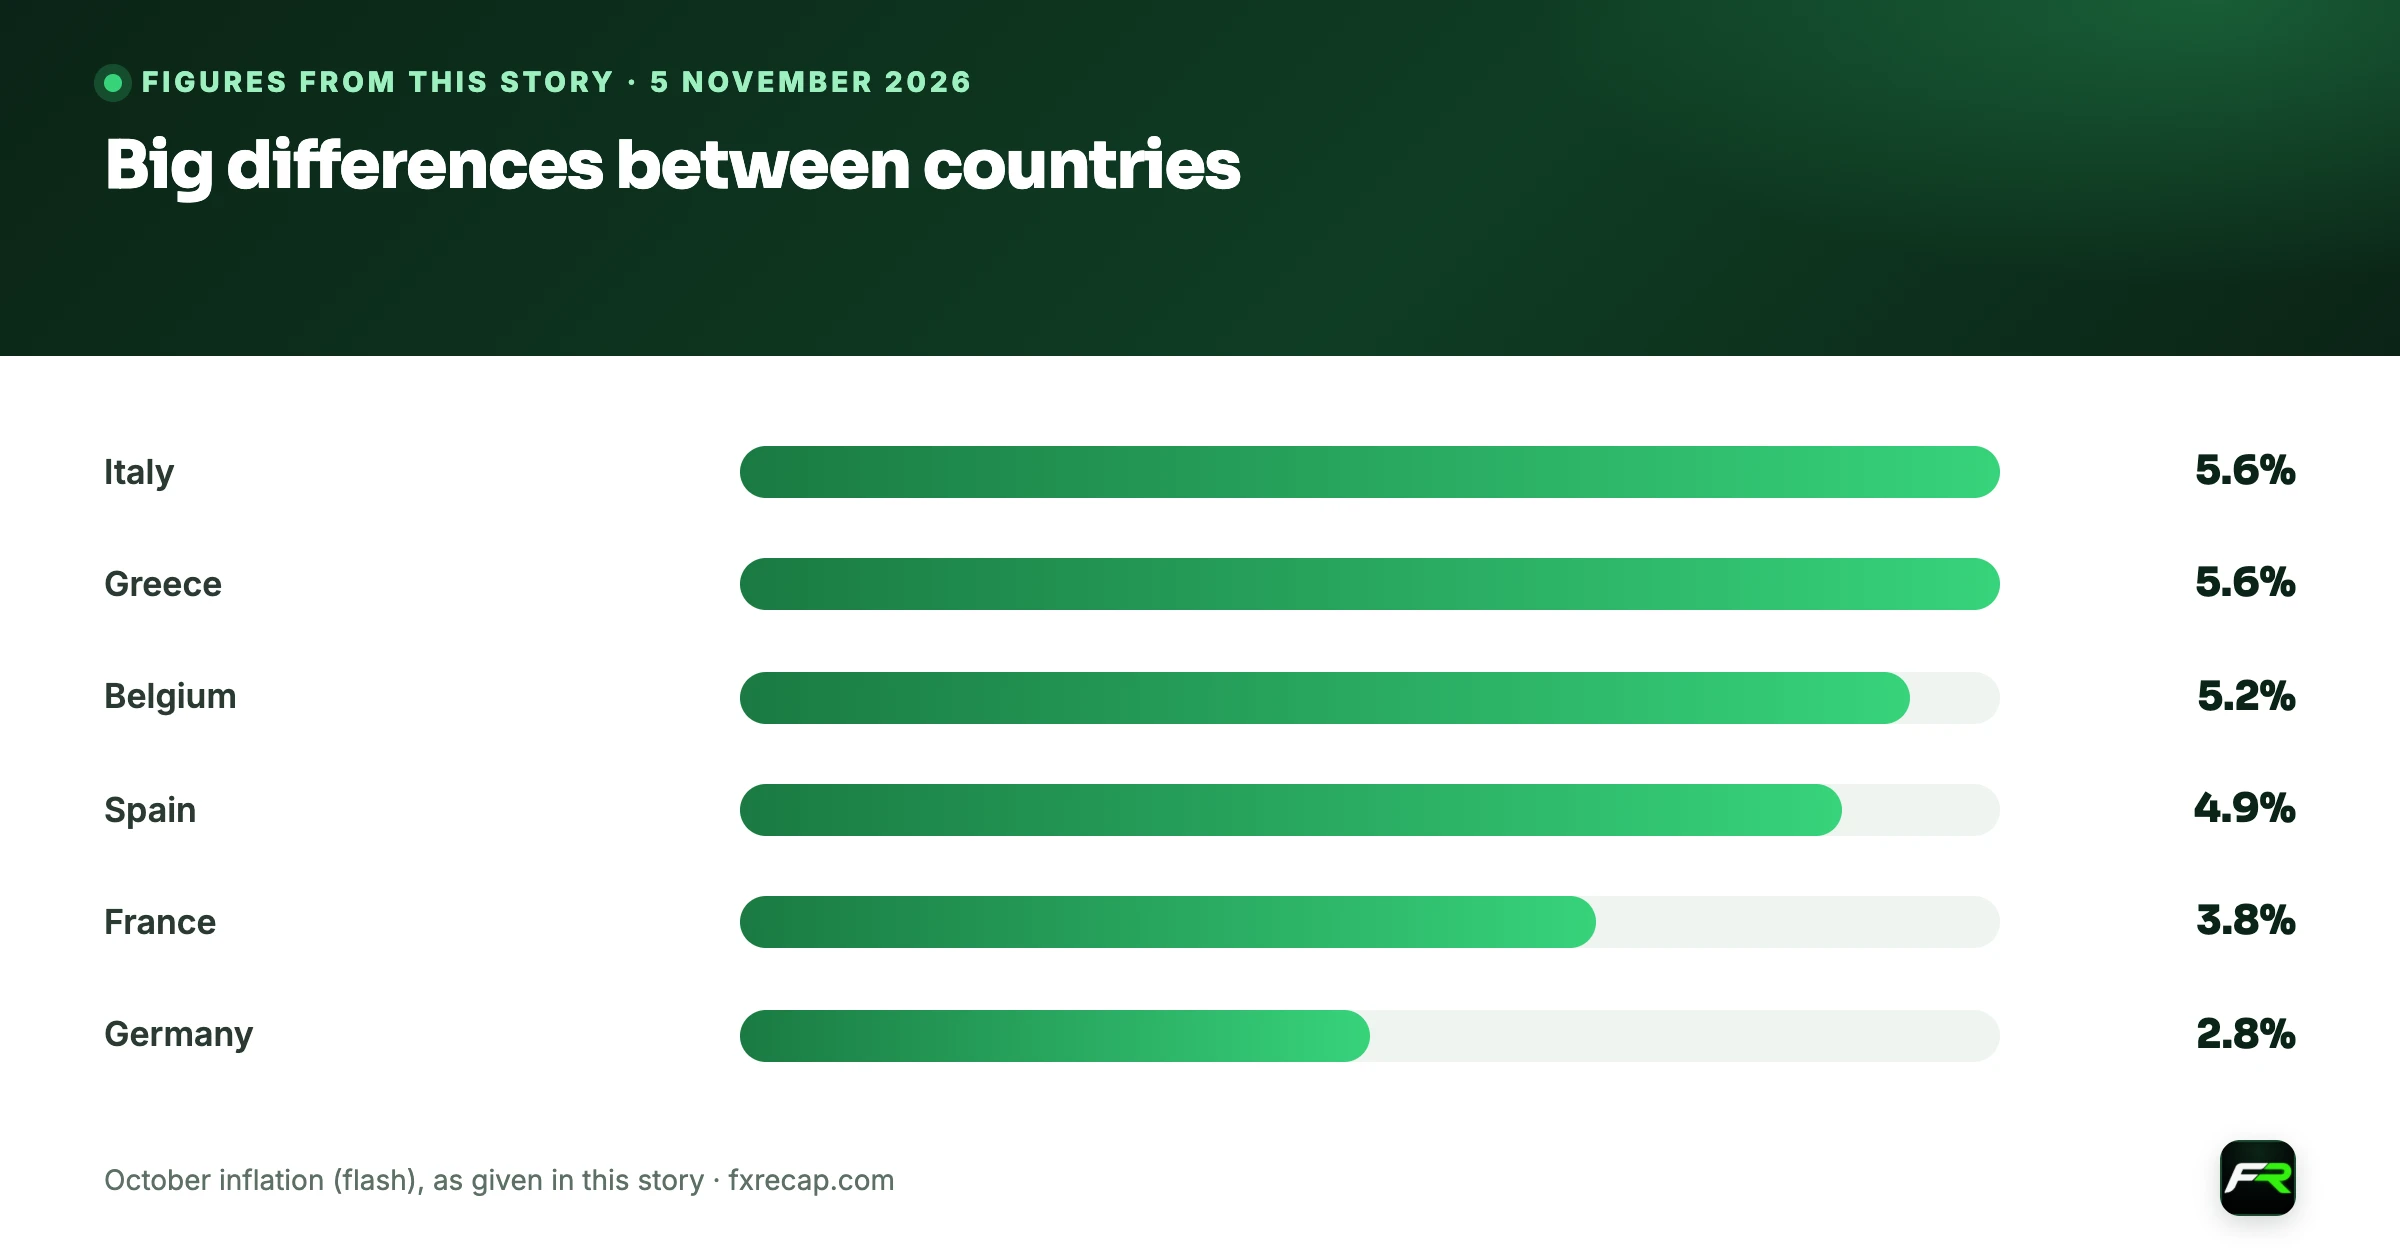
| Country | October inflation (flash) |
|---|---|
| Italy | 5.6% |
| Greece | 5.6% |
| Belgium | 5.2% |
| Spain | 4.9% |
| France | 3.8% |
| Germany | 2.8% |
Those gaps matter for the ECB because one interest rate has to serve all 21 members. A rise would bite harder in economies that are already slowing. Eurostat's preliminary estimate showed French output shrinking 0.1% in the third quarter while the euro area as a whole grew 0.4%, as our GDP report explained. Higher inflation in the south and slower growth in the core make the policy choice harder, not easier.
Flash figures are estimates. Eurostat publishes the complete October data on 18 November, and country figures in particular can be revised. Germany's slowdown, for example, will be checked against the full national data before traders lean on it.
What it means for the ECB in December
The Governing Council held its three key rates on 29 October, with the deposit facility rate at 2.50%, after rises in June and September. President Christine Lagarde said at the press conference that the council had debated whether a hike was appropriate and chose unanimously to wait. She listed what officials would see before the next decision on 17 December, including two inflation releases and new staff projections, and said underlying inflation would “probably take a particular standing” in that assessment.
October's flash is the first of those two inflation releases. On the headline, it strengthens the case for a rise: 4.0% is double the target. On the measure Lagarde singled out, it changes little, because core inflation is flat at 2.5% and services rose only a tenth. A central bank worried mainly about second-round effects may see that as reason to keep waiting, while one worried about expectations may not want to risk a fifth month of rising headline inflation.
Growth is the other weight on the scale. Euro area GDP rose 0.4% in the third quarter, down from 0.6%, and the unemployment rate was 6.5% in September. Higher bond yields have already tightened financing conditions, a point the ECB made in its October statement. The November flash estimate, the second inflation release on Lagarde's list, and the staff projections on 17 December will likely decide the outcome.
How EUR/USD moved and the levels to watch
The euro rose against the dollar after the release. On ECB reference rates EUR/USD went from 1.1179 on 3 November to 1.1267 on 4 November, the highest fixing since 6 October (1.1269). The pair had touched 1.1130 on 29 October, its lowest reference rate of 2026 so far. Other forces were at work too: the US dollar was also weaker after the US midterm vote, as our gold report covered, so not all of Wednesday's move belongs to the inflation data.
On reference rates EUR/USD now sits above its 20-day average of 1.1196 and at the top of its 20-day range, but below the 50-day average of 1.1365 and the 100-day average of 1.1421. The 14-day RSI is near 53, neutral. In plain terms, the short-term trend has turned up while the longer one still points down. A clear move above the 6 October level of 1.1269 would be the first sign of a larger turn; a slip back under 1.1196 would put the October lows back in focus.
What it means for traders
- Separate headline from core. Headline inflation tells you about energy; core and services inflation tell you what the ECB is likely to do. Watch both in the full data on 18 November.
- Track ECB speakers. Comments over the next few weeks will show whether officials treat 4.0% as a reason to act in December or as an energy effect to look through.
- Remember the dollar side. The US jobs report on Friday and US CPI next week can move EUR/USD as much as euro data.
- Our EUR/USD analysis has the live price and daily levels, and the economic calendar lists every release time.
Suppose you buy EUR/USD at 1.1260 on the view that December is live, with a stop at 1.1190, just below the 20-day average and 70 pips away. On a $3,000 account risking 1%, your loss limit is $30, so each pip can be worth about $0.43, roughly 4,300 units. If the US jobs report pushes the pair through your stop with a gap, the loss can be larger. Our <a href="/position-size-calculator">position size calculator</a> does the sizing for any account.
Data releases can move currencies sharply, and flash estimates are often revised. Leverage magnifies losses as well as gains, so trade only with money you can afford to lose. This article is news and education, not a recommendation to buy or sell.
Inflation figures are from Eurostat's flash estimate for October 2026, published on 4 November. ECB quotes are from its 29 October press conference. GDP and unemployment are from Eurostat's releases of 30 October. Exchange rates are ECB euro reference rates, one fixing a day, not intraday highs or lows.
Cite this guide
FX Recap, "Euro Area Inflation Rises to 4.0% in October as Energy Prices Climb 20.8%", updated 5 November 2026, https://fxrecap.com/forex-news/top-stories/euro-area-inflation-4-percent-october-2026
Free to quote with a link. Journalists: data and comment in our press room.
Frequently asked
What is euro area inflation in October 2026?
Eurostat's flash estimate puts annual inflation at 4.0% in October 2026, up from 3.8% in September. Prices rose 0.4% on the month. The complete data is due on 18 November.
Why is euro area inflation rising?
Mostly energy. Energy prices were 20.8% higher than a year earlier, up from 18.9% in September. Core inflation, which excludes energy, food, alcohol and tobacco, stayed at 2.5%.
Which euro area country has the highest inflation?
In the October flash estimate, Italy and Greece had the highest rates at 5.6%, followed by Belgium at 5.2%. Germany slowed to 2.8% and France rose to 3.8%.
Will the ECB raise rates in December 2026?
That is not decided. The ECB held at 2.50% on 29 October after debating a rise. Higher headline inflation supports a rise, but core inflation was flat at 2.5%. The 17 December decision will use new staff projections.
Sources: Eurostat: euro area flash inflation estimate, October 2026 · ECB: monetary policy statement and press conference, 29 October 2026 · ECB: euro foreign exchange reference rates · Eurostat: GDP preliminary flash estimate, third quarter 2026 · Eurostat: euro area unemployment, September 2026
The team behind this guide
Researched, checked and approved by five forex specialists
Every guide is written, fact-checked and edited before it goes live, and updated when the facts change. Spotted an error? Tell us.