IC Markets




































Dollar Ends the Week Lower as Yields Slide, Even With US Import Prices Up 8.1%
The dollar index lost 0.4% as 10-year Treasury yields fell to 5.09%, while US crude jumped almost 8% and import costs kept rising.
 WriterAbir KhanWriterWrites the guides · checks every figure against primary sources View profileAbout Abir →
 Market analysisTanbir Habib RiyadForex & Crypto AnalystForex and crypto analyst · technical and fundamental analysis View profileAbout Tanbir →
 Fact-checking & riskJannatul FerdaushFact-Checker & Risk AnalystFact-checks every figure · risk analysis · Applied Statistics, University of Dhaka View profileAbout Jannatul →
 Trading reviewJowel RanaCo-Founder & Forex TraderCo-founder · forex trader · reviews guides from a trader's view View profileAbout Jowel →
 Final approvalRanjan NiskrityFounder, Owner & Forex TraderFounder and owner · forex trader · signs off every guide View profileAbout Ranjan →
The dollar finished a week of hot US inflation data lower, not higher. By Friday's close the dollar index stood near 101.78, down 0.44% from a week earlier and close to its weekly low of 101.58, after touching 102.95 on Wednesday. Against it, the euro, the pound, the yen and the Canadian dollar all gained.
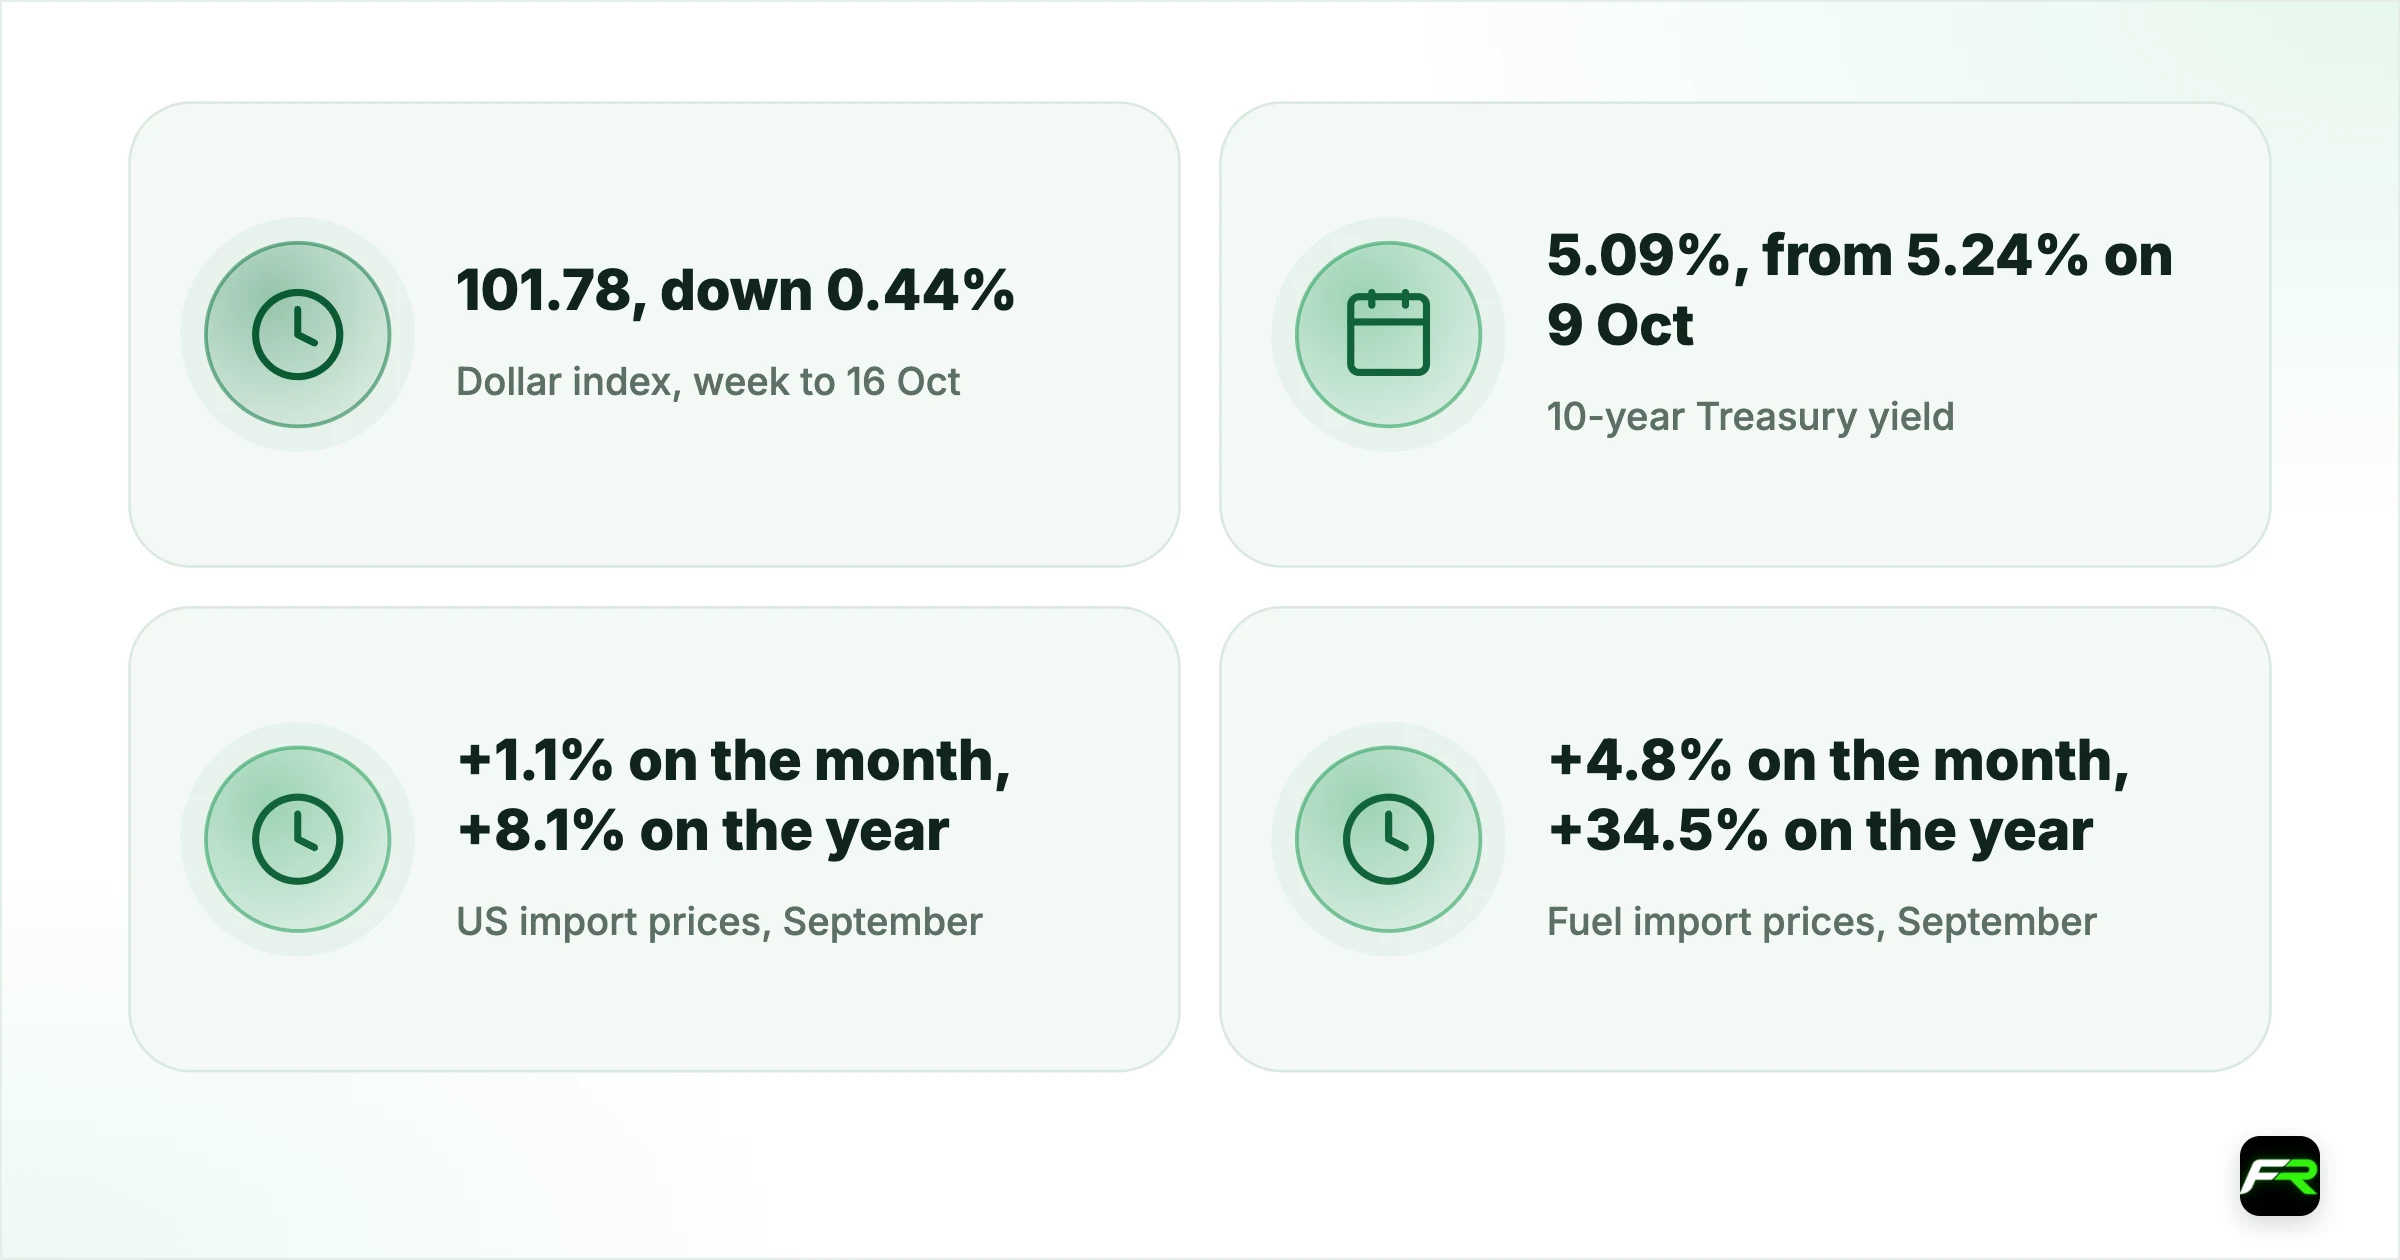
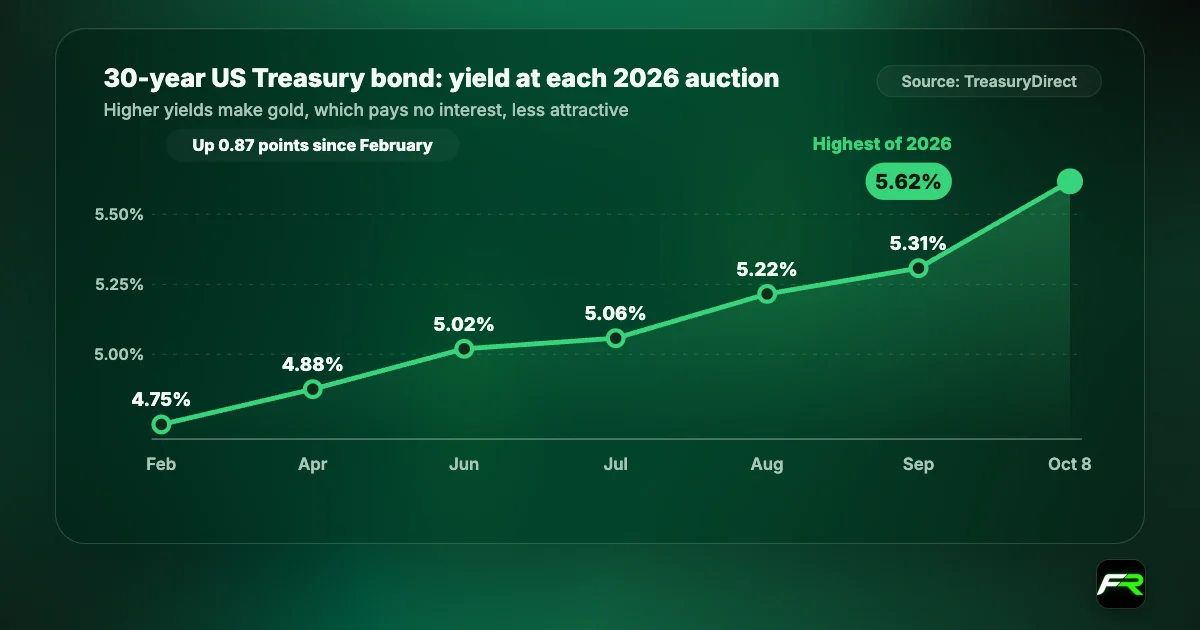
Bonds explain most of the move. The US Treasury's daily yield curve shows the 10-year yield at 5.09% on Friday, down from 5.24% a week earlier and the lowest close since 22 September. Longer bonds rallied too: the 30-year yield fell to 5.43% from 5.60%, while the 2-year eased only to 4.74% from 4.80%. That is the reverse of what a string of strong inflation reports would normally bring, and in our view it removed the dollar's main support this autumn: the extra yield on US assets.
Friday added two more official reports. The Bureau of Labor Statistics said US import prices rose 1.1% in September and 8.1% over the year, the largest annual rise since July 2022. Separately, the Federal Reserve reported that industrial production jumped 0.7%, helped by a 3.5% surge in utility output. Oil climbed as well: US crude futures ended the week near $99 a barrel, up almost 8%, and Brent touched $110 on Friday.
| Dollar index, week to 16 Oct | 101.78, down 0.44% |
|---|---|
| 10-year Treasury yield (US Treasury) | 5.09%, from 5.24% on 9 Oct |
| US import prices, September (BLS) | +1.1% on the month, +8.1% on the year |
| Fuel import prices, September | +4.8% on the month, +34.5% on the year |
| Industrial production, September (Fed) | +0.7%; capacity use 76.9% |
| WTI crude futures, Friday close | $99.04, up 7.8% on the week |
| Next Fed decision | 28 October, 14:00 New York time |
How major markets finished the week
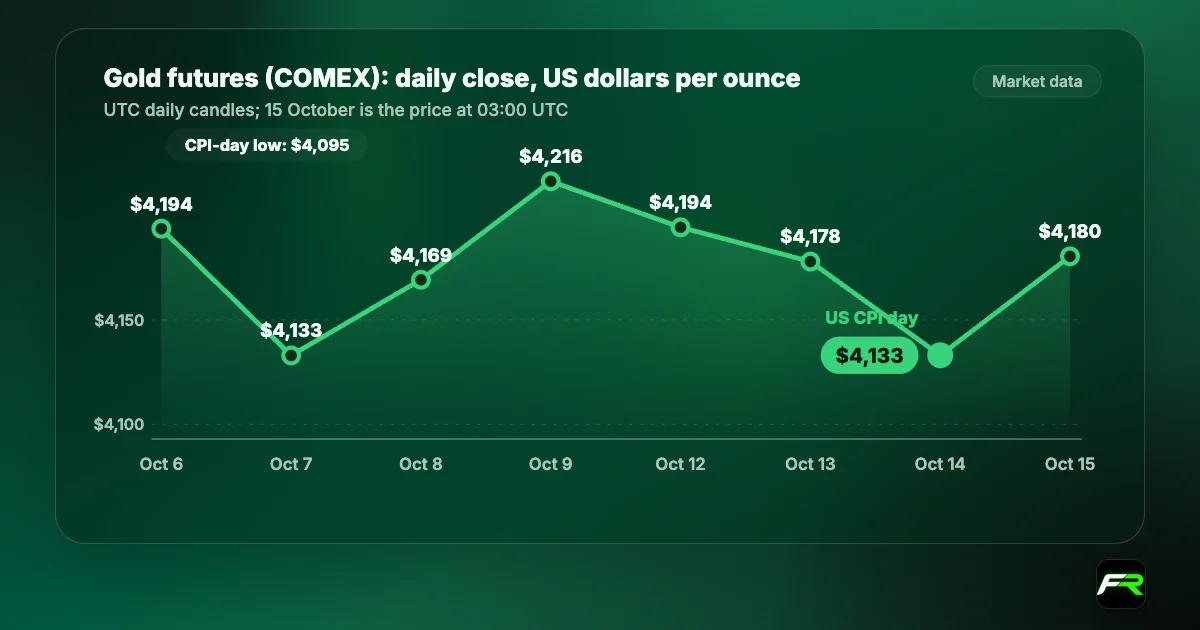
The table compares Friday's close with the close a week earlier, both read from hourly market data at about 21:00 UTC. The Canadian dollar gained most against the US dollar in a week when oil rallied, and the Australian dollar was the only currency in the group to lose ground. Gold slipped despite the softer dollar, after a sharp drop on Wednesday that it only partly recovered.
| Market | Close 9 Oct | Close 16 Oct | Weekly change | Week's range |
|---|---|---|---|---|
| Dollar index | 102.23 | 101.78 | −0.44% | 101.58 to 102.95 |
| EUR/USD | 1.1206 | 1.1244 | +0.34% | 1.1117 to 1.1273 |
| GBP/USD | 1.3233 | 1.3330 | +0.73% | 1.3139 to 1.3371 |
| USD/JPY | 158.25 | 157.99 | −0.16% | 157.54 to 158.95 |
| USD/CAD | 1.4254 | 1.4137 | −0.82% | 1.4131 to 1.4300 |
| AUD/USD | 0.6988 | 0.6949 | −0.56% | 0.6899 to 0.7015 |
| Gold futures (COMEX) | $4,216.3 | $4,186.7 | −0.70% | $4,095.0 to $4,242.3 |
| WTI crude futures | $91.85 | $99.04 | +7.83% | $89.61 to $99.34 |
UTC candles built from hourly market data; levels differ slightly between providers. Spot gold was about $4,166 an ounce at 03:03 UTC on Saturday, according to gold-api.com.
Import prices: inflation still arriving at the border
The BLS report shows price pressure entering the US from abroad on almost every front. Fuel import prices rose 4.8% in September after two monthly declines, with petroleum products up 4.6% and natural gas up 1.6%. Over 12 months, fuel imports cost 34.5% more, petroleum products 35.4% more and natural gas 96.5% more, the steepest annual rise for gas since the year to June 2022.
Fuel is not the whole story. Nonfuel import prices climbed 0.7% in the month and have not fallen on a monthly basis since August 2025. Over the year they are up 6.0%, the largest rise since the 12 months to April 2022. Capital goods rose 0.9% for a second month, led by computers, semiconductors and industrial machinery, and nonfuel industrial supplies gained 1.4%. Food import prices were flat. Imports from China rose 0.7%, their biggest monthly increase since December 2021.
Export prices moved even faster. They jumped 2.2% in September and 11.6% over the year, the largest annual gain since the 12 months to July 2022. Agricultural exports rose 2.6%, led by soybeans, corn and wheat, and nonagricultural industrial supplies climbed 4.0% on higher prices for petroleum, natural gas and chemicals.
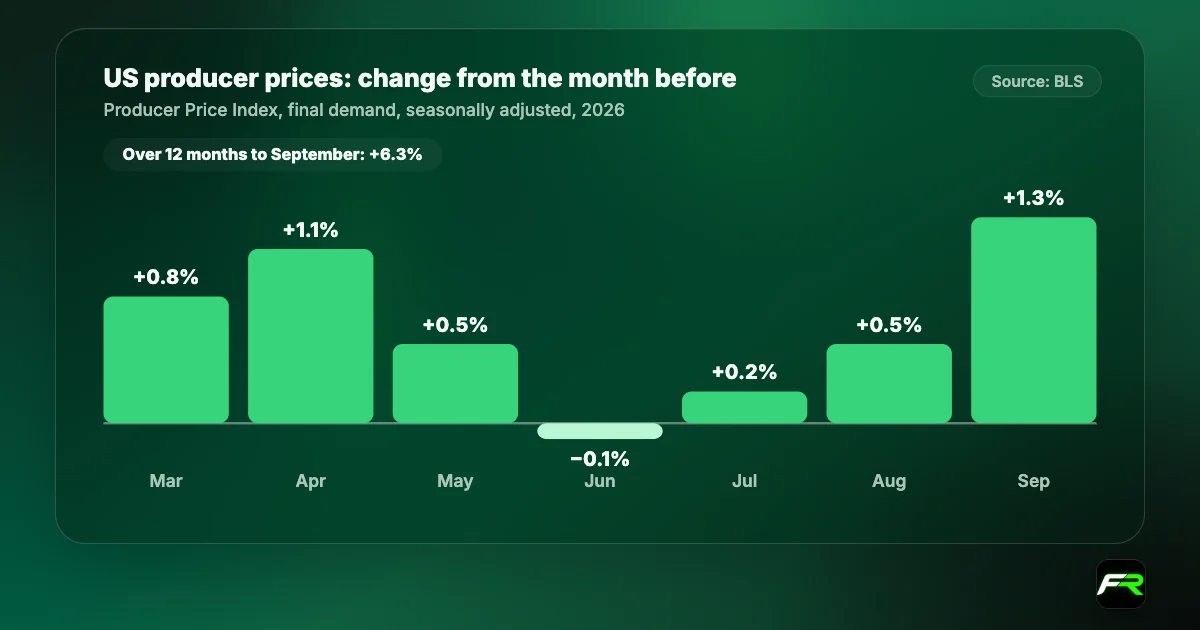
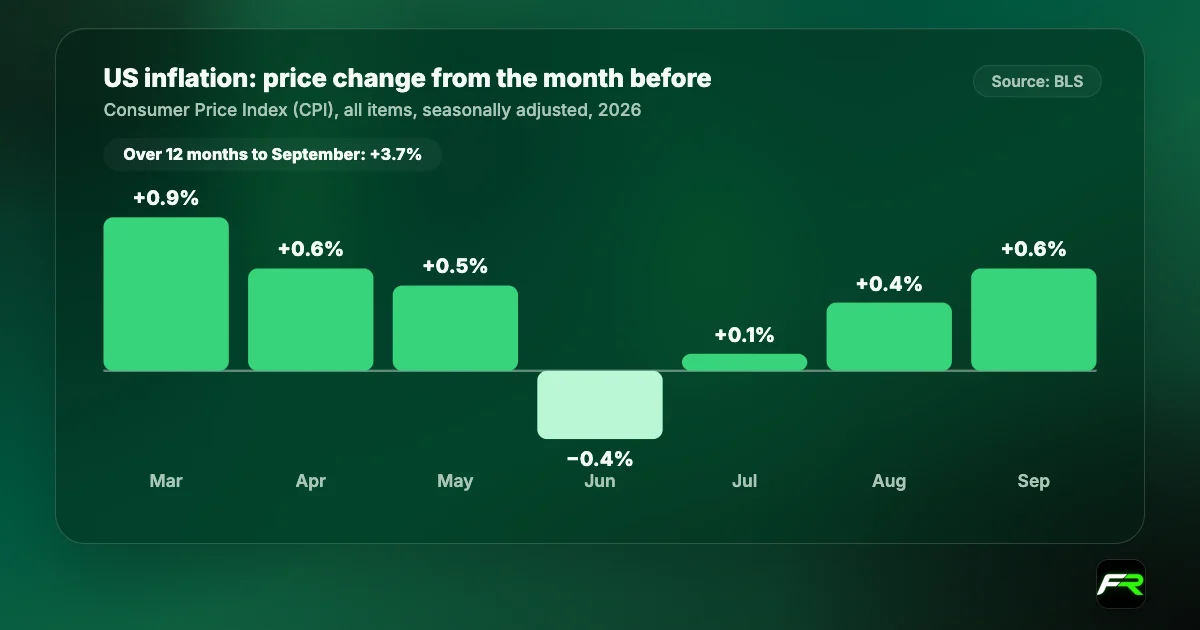
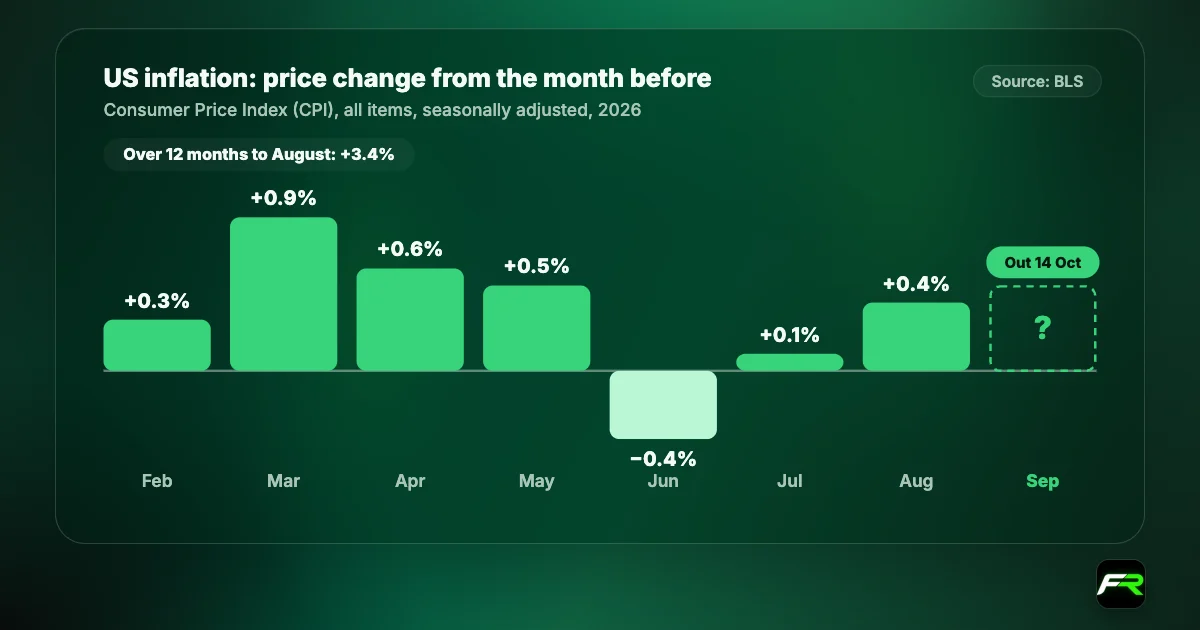
Import prices matter for currency traders because they flow into the consumer prices the Fed targets, usually with a lag. Taken together with September's 3.7% CPI and 6.3% PPI, Friday's report shows inflation pressure at every stage of the US supply chain. The BLS will publish October import prices on Tuesday 17 November, three weeks after the Fed meets.
Industrial production rises 0.7% as utilities surge
The Federal Reserve's G.17 report showed industrial production rising 0.7% in September after a 0.1% gain in August, which was revised up from no change. Over the third quarter, output grew at an annual rate of 2.8%. Manufacturing rose 0.3%, mining 0.2% and utilities 3.5%. At 104.0% of its 2017 average, total output stood 2.2% above its level a year earlier.
Capacity utilisation climbed to 76.9%, still 2.5 percentage points below its long-run average for 1972 to 2025. Utility output is 8.7% higher than a year ago and business equipment 6.7% higher, while consumer goods production is down 0.1% over the year. Manufacturing is up just 1.1% on the year.
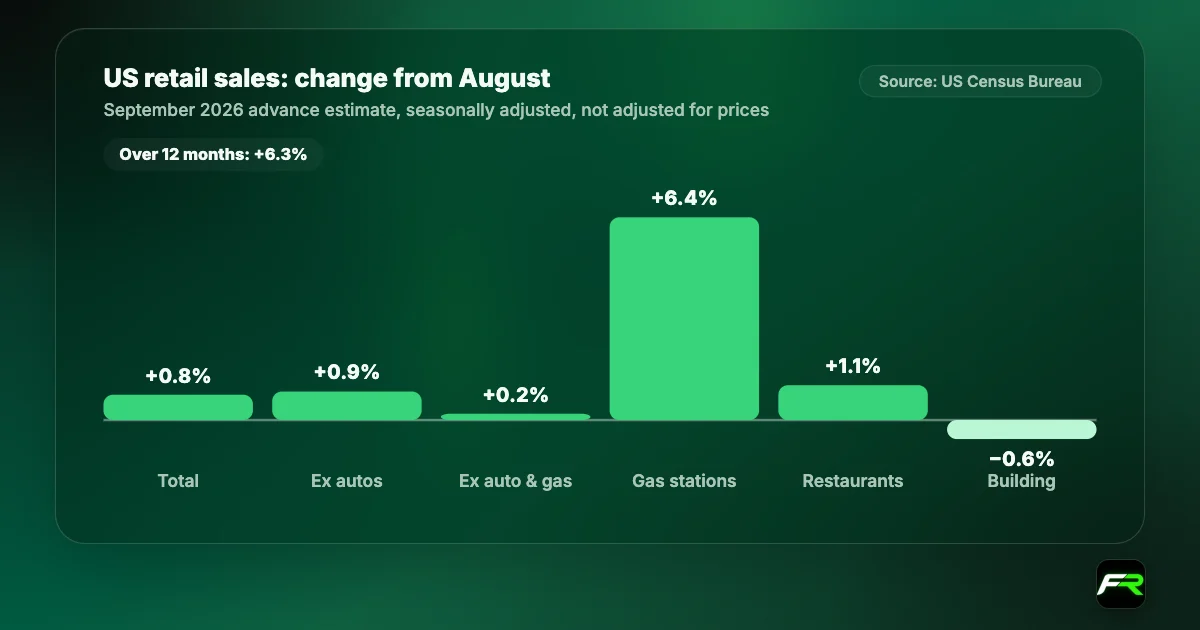
Our reading is that US industry is holding up better than households. Investment in equipment is growing and factories are still adding output, but production of consumer goods has gone nowhere in a year. That fits Thursday's retail sales report, where spending outside autos and fuel rose only 0.2%. A resilient factory sector gives the Fed less reason to worry about growth, which matters for the dollar ahead of 28 October.
Oil climbs toward $100 while bond yields fall
WTI crude futures rose 3.0% on Friday alone, reaching $99.34 before closing at $99.04, and gained 7.8% over the week. Brent futures ended at $109.69 after touching $110.00, up 4.7% on the week. We could not find an official explanation for Friday's jump, so we do not offer one here. Higher crude prices feed directly into the fuel import costs described above and into the gasoline figures behind September's consumer prices.
Rising oil and falling long-term yields in the same week send a mixed message. When energy costs climb, bond buyers usually demand more yield to protect against inflation. This week they accepted less, which suggests markets are weighing the risk that expensive fuel slows the economy more heavily than the risk of further price rises. That is our interpretation, not an official view, and it can change quickly if October data show demand holding up.
For the dollar, the bond market has mattered more than the inflation data this autumn. Watch the 10-year yield beside EUR/USD and USD/JPY. On Friday, as the 10-year slipped again, EUR/USD rose 0.25% and USD/JPY eased 0.09%.
Euro area inflation confirmed at 3.8%
Eurostat confirmed on Friday that euro area inflation rose to 3.8% in September from 3.2% in August, against 2.2% a year earlier. Prices rose 0.6% in the month. Energy added 1.71 percentage points to the annual rate and services 1.52 points. Across the wider EU, the highest rates were in Romania (6.5%), Lithuania (6.1%) and Bulgaria (5.6%), and the lowest in Sweden (1.0%).
The European Central Bank raised its deposit rate to 2.50% on 10 September and decides again on 29 October. EUR/USD gained 0.34% on the week to 1.1244, and its Friday high of 1.1273 was the best level of the week. Our earlier euro area inflation story covers the flash estimate and the ECB background.
What it means for traders next week
The US calendar is light next week, so the dollar will take its lead from yields, oil and data abroad. Our week-ahead preview lists every release and its time.
- Track the 10-year Treasury yield first. A move back above 5.20% would challenge this week's dollar weakness; a drop toward 5.00% would extend it.
- Watch crude near $100. A sustained break above that level would add to inflation worries and could revive demand for the dollar, or deepen growth fears and push yields lower still.
- Respect the ranges. EUR/USD spent the week between 1.1117 and 1.1273, and USD/JPY between 157.54 and 158.95; breaks of those levels are the signals to watch.
- Reduce size into 28 October, when the Fed, the Bank of Canada and the Reserve Bank of New Zealand all announce decisions.
- Use the position size calculator so a single loss stays within 1% to 2% of your account.
Say you buy EUR/USD at 1.1244 on the view that falling yields keep pressure on the dollar, with a stop below Wednesday's low at 1.1110, a 134-pip risk. A mini lot of 10,000 units is worth about $1 a pip, so the stop costs about $134. On an $8,000 account with a 1% limit of $80, that is too large: about 6,000 units keeps the loss near $80. A wide stop is fine, as long as the size shrinks to match.
Levels and trade plans are in our daily EUR/USD analysis, USD/JPY analysis and gold analysis, which show Friday's close over the weekend.
Oil, yields and currencies can move sharply when markets reopen after a weekend. Leverage magnifies losses as well as gains, so trade only with money you can afford to lose.
Import and export price figures and the next release date are from the US Bureau of Labor Statistics. Industrial production and capacity utilisation are from the Federal Reserve's G.17 release. Yields are from the US Treasury's daily par yield curve, and euro area inflation is from Eurostat. Rate decisions and meeting dates are from the central banks. Currency, dollar index, oil and gold levels are market data built from hourly bars and differ slightly between providers. Explanations of market moves are FX Recap's own reading. This is news, not investment advice.
Frequently asked
Why did the dollar fall this week despite high US inflation?
US Treasury yields fell. The 10-year yield dropped to 5.09% on 16 October from 5.24% a week earlier, reducing the extra return on dollar assets. The dollar index lost 0.44% over the week to about 101.78.
What were US import prices in September 2026?
Import prices rose 1.1% in September and 8.1% over 12 months, the largest annual rise since July 2022, according to the Bureau of Labor Statistics. Fuel import prices were up 34.5% on the year.
How much did US industrial production rise in September 2026?
Industrial production rose 0.7% in September, the Federal Reserve said, with utilities up 3.5% and manufacturing up 0.3%. Capacity utilisation rose to 76.9%.
When is the next Fed decision?
The Federal Reserve announces its next decision on Wednesday 28 October 2026 at 14:00 New York time. Its target range has been 3.75% to 4.00% since 16 September.
Sources: US Bureau of Labor Statistics: Import and Export Price Indexes, September 2026 · Federal Reserve: Industrial Production and Capacity Utilization (G.17), September 2026 · US Treasury: daily par yield curve rates · Eurostat: Annual inflation up to 3.8% in the euro area · Federal Reserve: FOMC meeting calendar
The team behind this guide
Researched, checked and approved by five forex specialists
Every guide is written, fact-checked and edited before it goes live, and updated when the facts change. Spotted an error? Tell us.