IC Markets




































US Producer Prices Jump 1.3%, the Biggest Rise Since 2022, Yet Yields Fall
Wholesale energy prices rose 10.8% in September and annual PPI hit 6.3%. The dollar barely reacted as 10-year Treasury yields dropped to 5.10%.
 WriterAbir KhanWriterWrites the guides · checks every figure against primary sources View profileAbout Abir →
 Market analysisTanbir Habib RiyadForex & Crypto AnalystForex and crypto analyst · technical and fundamental analysis View profileAbout Tanbir →
 Fact-checking & riskJannatul FerdaushFact-Checker & Risk AnalystFact-checks every figure · risk analysis · Applied Statistics, University of Dhaka View profileAbout Jannatul →
 Trading reviewJowel RanaCo-Founder & Forex TraderCo-founder · forex trader · reviews guides from a trader's view View profileAbout Jowel →
 Final approvalRanjan NiskrityFounder, Owner & Forex TraderFounder and owner · forex trader · signs off every guide View profileAbout Ranjan →
Price pressure in the US pipeline jumped again in September. The Bureau of Labor Statistics said on Thursday that its Producer Price Index for final demand rose 1.3% on the month, the largest advance since March 2022, after a 0.5% gain in August. Over 12 months, producer prices climbed 6.3%, the steepest annual rise since December 2022.
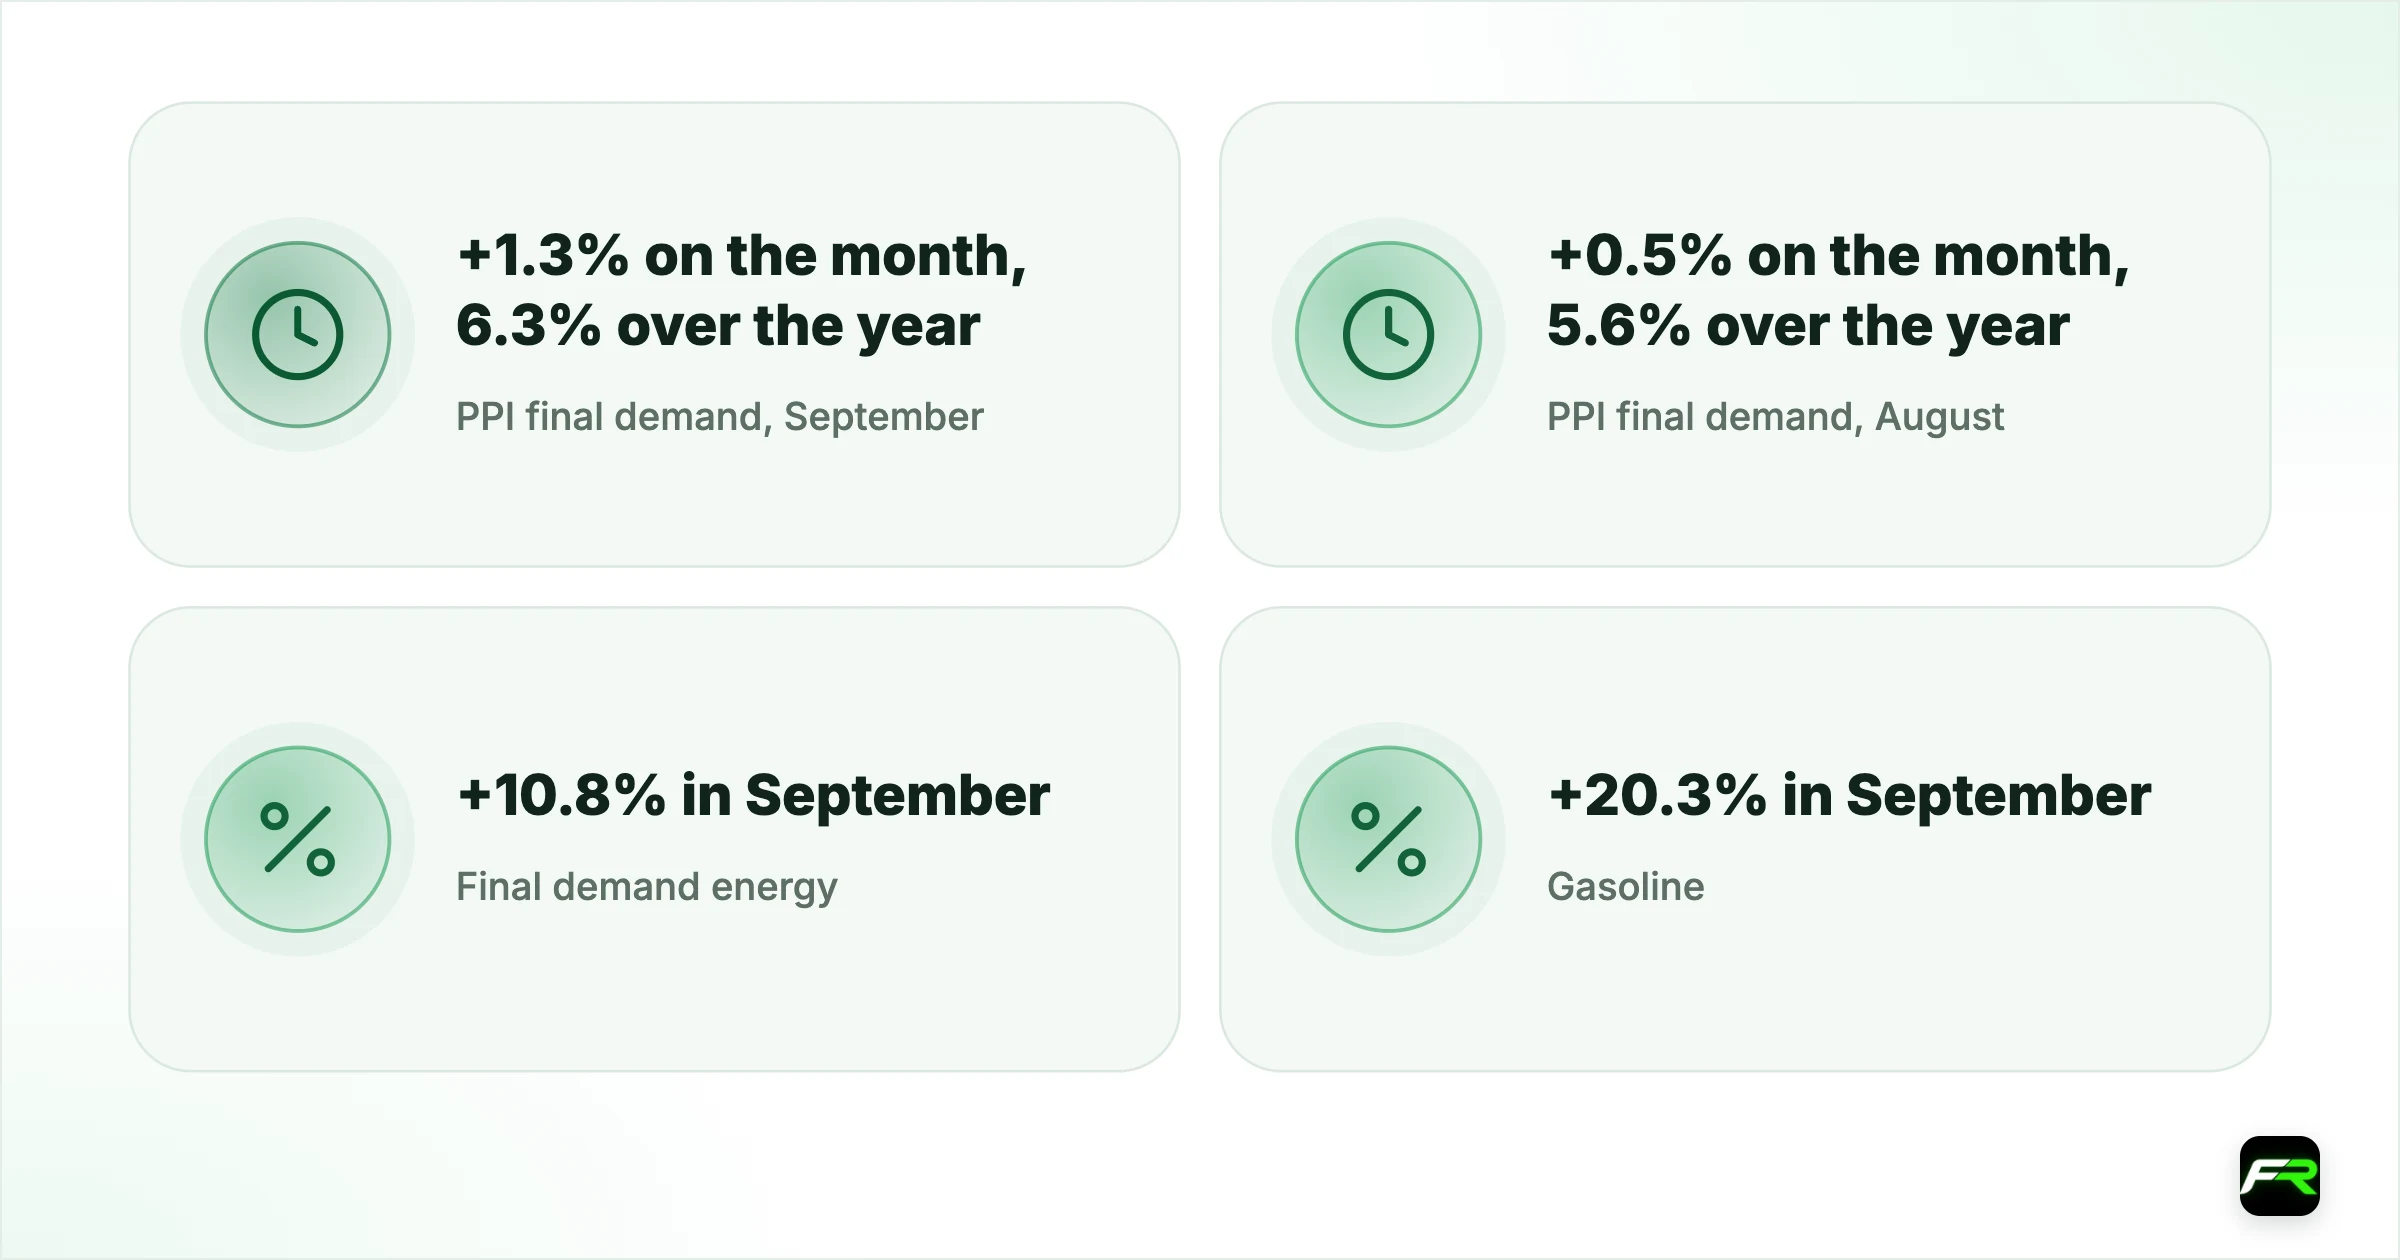
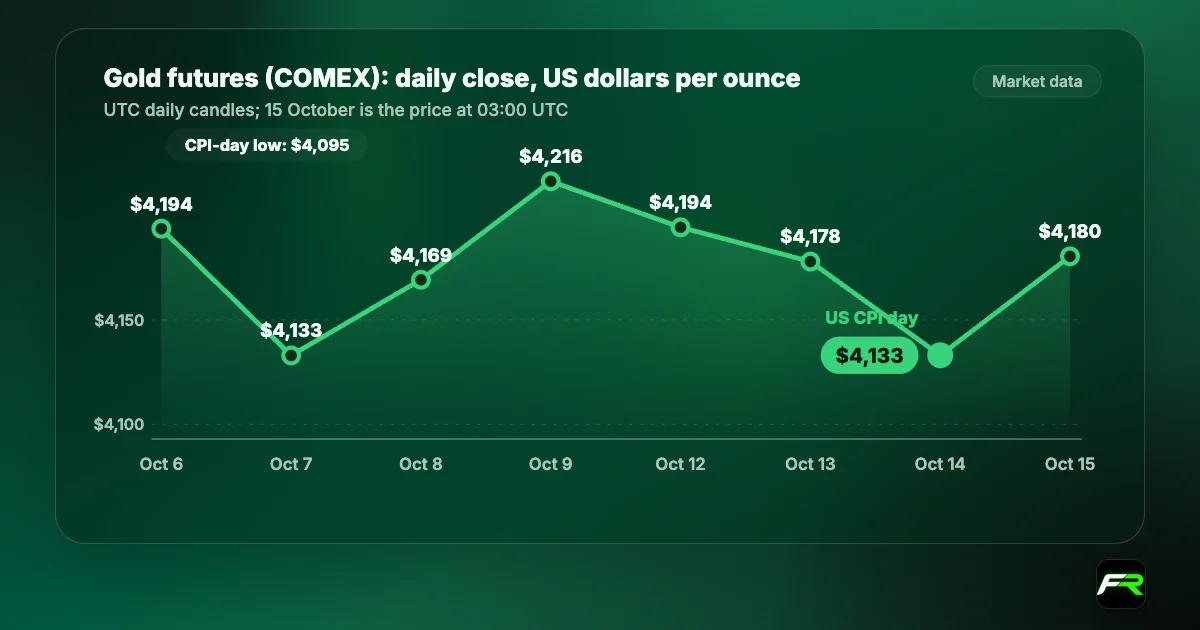
Energy did most of the damage. Final demand energy prices jumped 10.8% in a single month, and gasoline at the producer level rose 20.3%. Yet the market reaction was the opposite of what a hot inflation number usually brings. The dollar index ticked up to 102.26 in the minutes after the 12:30 UTC release, then slipped below 102.00 within the hour, and Treasury yields fell across the curve. By 03:00 UTC on Friday the index sat near 102.00, with EUR/USD at 1.1221 and gold futures back near $4,190.
| PPI final demand, September (BLS) | +1.3% on the month, 6.3% over the year |
|---|---|
| PPI final demand, August (revised) | +0.5% on the month, 5.6% over the year |
| Final demand energy | +10.8% in September |
| Gasoline (producer level) | +20.3% in September |
| Core PPI (less foods, energy, trade) | +0.5% on the month, 5.0% over the year |
| 10-year Treasury yield, 15 Oct | 5.10%, down from 5.19% |
| Next PPI report | October data on Friday 13 November |
What the September producer price report showed
Goods prices led the jump. Prices for final demand goods rose 2.6% in September, which the BLS says is the largest increase since it started calculating the series in December 2009. More than 80% of that rise came from energy. Half of the goods increase can be traced to gasoline alone, and diesel fuel, jet fuel, residential electricity and crude petroleum also rose. Food prices at the producer level climbed 1.2%, with fresh and dry vegetables higher, while chicken eggs fell 39.7%.
Services rose too, by 0.8%, the biggest gain since April. Nearly half of that came from a 1.4% rise in trade margins, the mark-up that wholesalers and retailers earn. Transportation and warehousing services climbed 3.4%, led by truck freight, which is how fuel costs travel into the price of almost everything else. Airline passenger services and hotel rooms also rose. On the other side, retail margins on motor fuels dropped 30.3%: gas stations absorbed part of the jump in wholesale fuel costs rather than passing it all on at once.
Core producer prices, which exclude food, energy and trade services, increased 0.5% after 0.3% in August and stand 5.0% higher than a year ago. That measure has risen 0.5% or more in six of the nine months of 2026, which tells you the pressure is not only about oil.
| Month (2026) | PPI final demand, monthly | Energy, monthly | PPI, 12 months |
|---|---|---|---|
| March | +0.8% | +10.5% | 4.3% |
| April | +1.1% | +7.1% | 5.7% |
| May | +0.5% | +8.2% | 5.9% |
| June | −0.1% | −6.8% | 5.6% |
| July | +0.2% | −1.7% | 4.9% |
| August | +0.5% | +4.5% | 5.6% |
| September | +1.3% | +10.8% | 6.3% |
Source: US Bureau of Labor Statistics, PPI release of 15 October 2026, Table A. May to August figures are revised.
Further back in the pipeline, the numbers are larger still. Processed goods for intermediate demand rose 2.5% on the month and 14.1% over the year, and unprocessed goods jumped 8.4% in September. These are the inputs that firms buy before they sell anything to a consumer, so they tend to show up in shop prices with a lag of a few months.
How the dollar, yields and gold reacted
Thursday was a quiet day for currencies given the size of the surprise. Hourly market data show the dollar index rising to 102.26 in the hour of the release and then falling to 101.97 in the next one. EUR/USD dipped to 1.1194 and was back at 1.1221 an hour later. Over the full UTC day, the index lost about 0.15%, ending near 102.05.
| Market | Open 15 Oct (UTC) | Day's range | Close 15 Oct | 16 Oct, about 03:00 UTC |
|---|---|---|---|---|
| Dollar index | 102.21 | 101.88 to 102.28 | 102.05 | 102.00 |
| EUR/USD | 1.1199 | 1.1191 to 1.1244 | 1.1216 | 1.1221 |
| USD/JPY | 157.97 | 157.54 to 158.25 | 158.13 | 157.97 |
| Gold futures (COMEX) | $4,133.2 | $4,132.0 to $4,197.7 | $4,176.9 | $4,190.2 |
UTC candles built from hourly market data; levels differ slightly between providers.
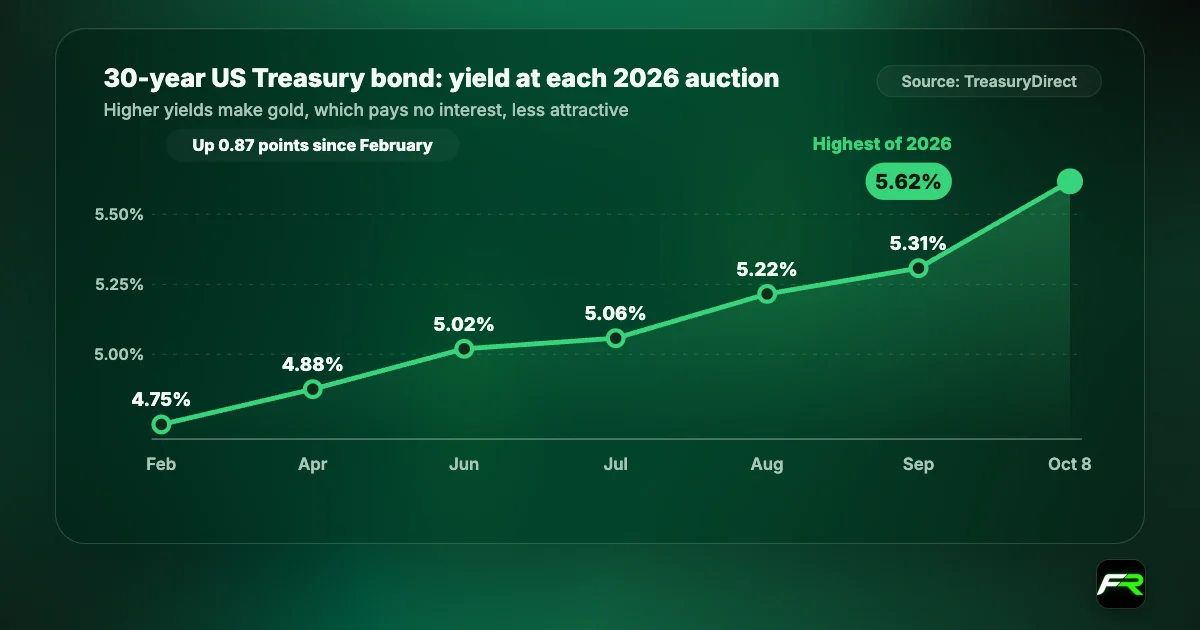
Bonds moved more than currencies. According to the US Treasury's daily par yield curve, the 10-year yield fell to 5.10% on Thursday from 5.19% on Wednesday, its lowest close since 22 September. The 30-year yield dropped to 5.43% from 5.52%, and the 2-year eased to 4.77% from 4.82%. Gold liked the lower yields: futures rose about $66 from the day's low and touched $4,197.70 in the last hours of US trading.
Why a hot number did not lift the dollar
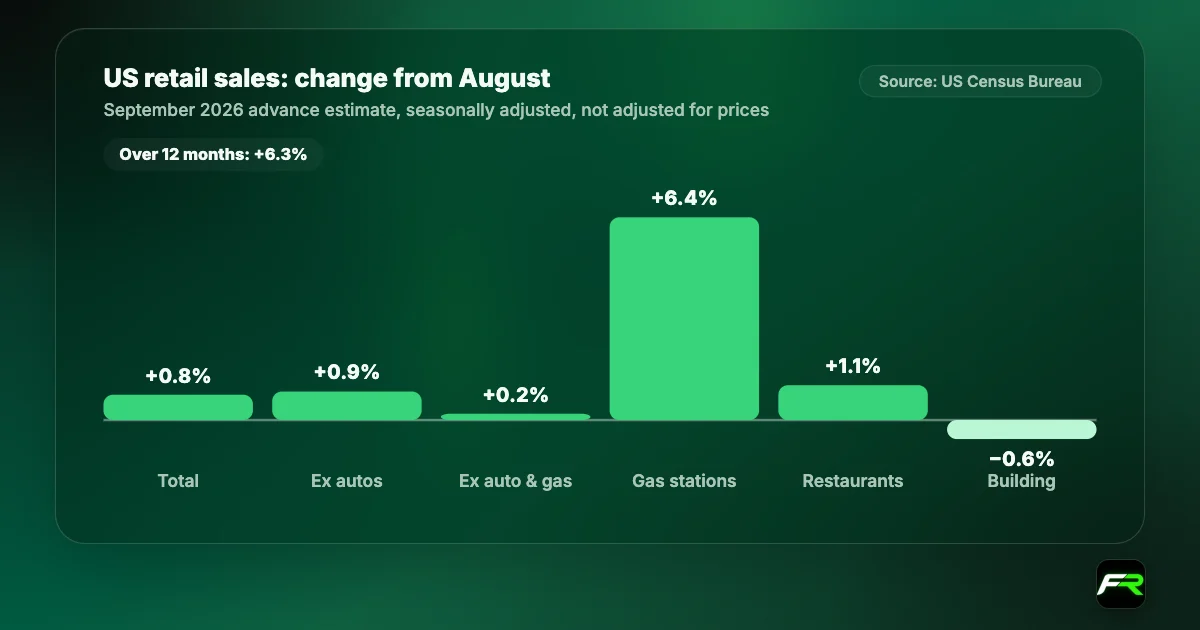
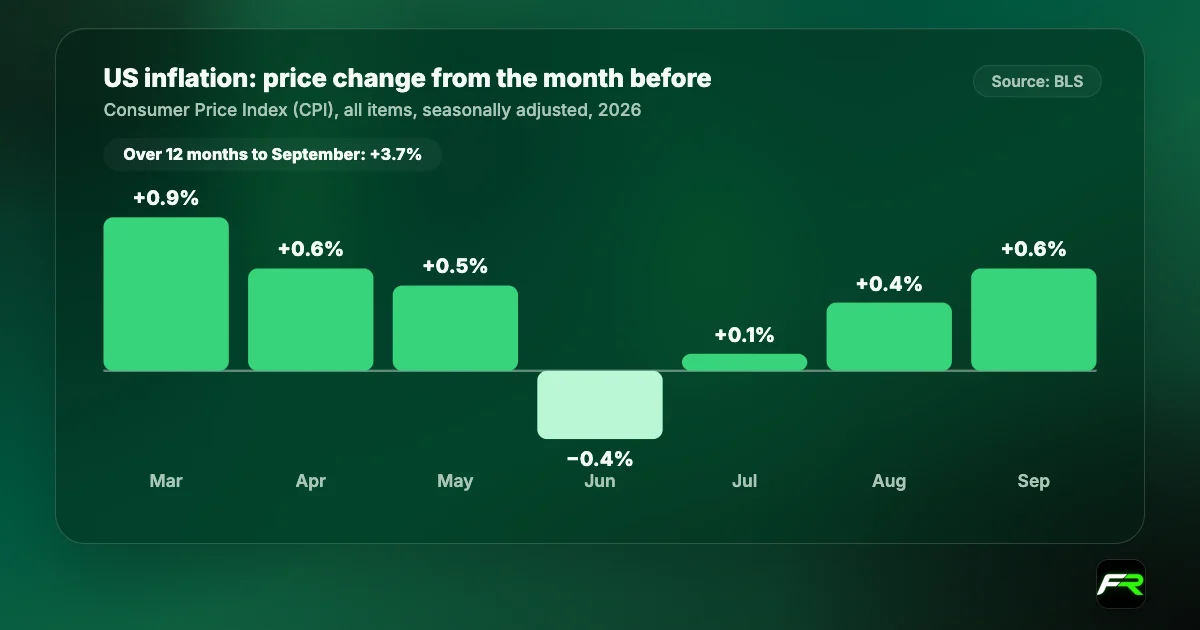
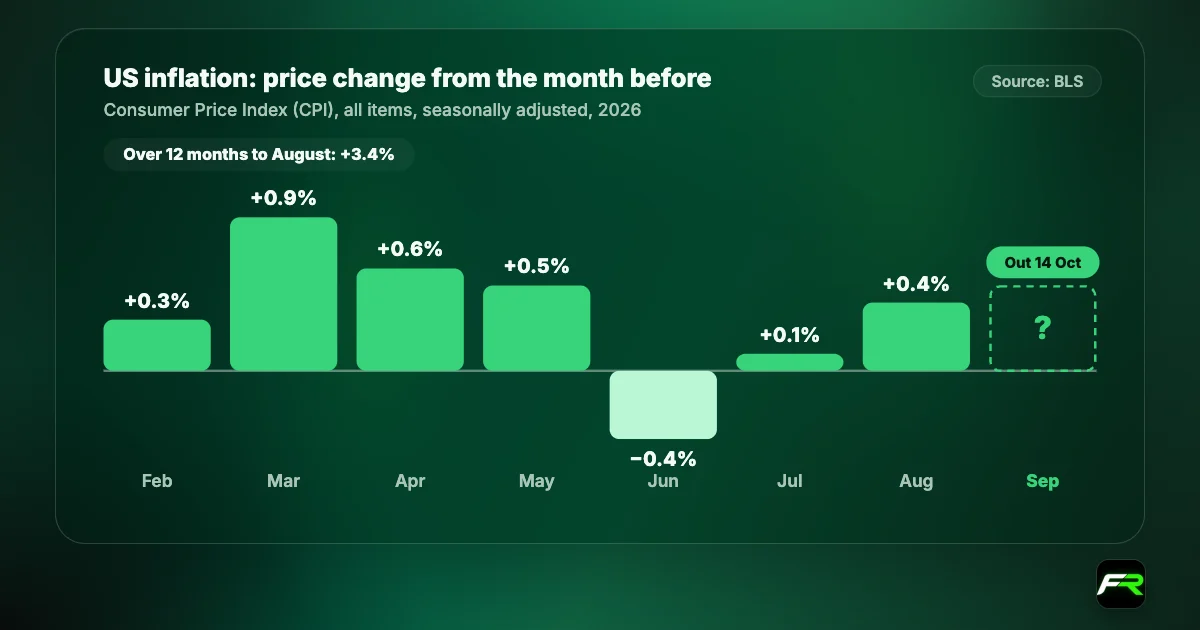
No official body explains market moves, so treat this as our reading. Three things seem to have blunted the reaction. First, most of the surprise was energy, and traders had already seen gasoline jump 9.1% in the consumer price report a day earlier. Second, the same morning brought US retail sales, which showed shoppers spending more on fuel but little extra elsewhere; our retail sales story has the detail. Third, long-dated Treasury yields were already sliding, and they have been the dollar's main support this autumn.
That third point matters most for currency traders. When long yields fall even as inflation rises, the market is signalling that it worries about growth as much as prices. A Fed that raises rates into an energy shock can slow the economy, and bond buyers seem to be betting on that outcome. Higher prices with weaker demand is not a clean story for the dollar, which helps explain why it went sideways.
What it means for the Fed on 28 October
The Federal Reserve raised its target range by a quarter point to 3.75% to 4.00% on 16 September. Its policy committee meets next on 27 and 28 October, with the decision on the 28th. September's producer and consumer price reports are the last inflation data before that meeting: the BLS will publish October producer prices on Friday 13 November.
For officials, the PPI report strengthens the case that energy costs are spreading. Truck freight, trade margins, airfares and hotel rates all rose, and core producer prices are running at 5.0% a year. Consumer core inflation is lower, at 2.6% in September, but producer prices often lead consumer prices by a few months. A committee that worries about second-round effects will find plenty in this report. Against that, falling long-term yields and flat hiring argue for patience. Both outcomes on 28 October are possible, and you should trade as if either could happen.
How to trade the next two weeks
Two days of hot inflation data have produced two days of dollar moves that faded. That pattern can break, and it often breaks when traders least expect it. A few practical rules help.
- Watch the 10-year Treasury yield beside EUR/USD and USD/JPY. This week it has been a better guide to the dollar's direction than the inflation numbers themselves.
- Do not chase the first spike after a release. On Thursday the dollar's high and its low came within about an hour of each other.
- Keep an eye on oil: WTI crude futures ended Thursday near $96 and Brent near $106, so the energy squeeze behind September's numbers has not eased.
- Mark 28 October in your economic calendar and reduce size into the Fed decision.
- Size every trade with the position size calculator so a single loss stays within 1% to 2% of your account.
Say you buy gold at $4,190 expecting lower yields to keep supporting it, with a stop at $4,150. That is $40 of risk per ounce. On a 10-ounce position the stop costs $400 plus spread. If your account is $20,000 and you risk 1%, the right size is $200, so 5 ounces, not 10. The same discipline applies to EUR/USD: a 50-pip stop on a mini lot risks about $50.
Our daily EUR/USD analysis, USD/JPY analysis and gold analysis carry today's levels and trade plans.
Inflation data and central bank meetings can move prices sharply in seconds. Leverage magnifies those moves, so size each trade by the money you can afford to lose.
Producer price figures and the next release date are from the US Bureau of Labor Statistics. Yields are from the US Treasury's daily par yield curve, and the rate decision and meeting dates are from the Federal Reserve. Currency, dollar index, oil and gold levels are market data built from hourly bars and differ slightly between providers. The explanation of why the dollar did not rally is FX Recap's own reading. This is news, not investment advice.
Frequently asked
What was US PPI in September 2026?
The Producer Price Index for final demand rose 1.3% in September, seasonally adjusted, and 6.3% over 12 months, according to the Bureau of Labor Statistics. It was the largest monthly rise since March 2022.
Why did producer prices rise so much?
Energy. Final demand energy prices jumped 10.8% in September and gasoline rose 20.3% at the producer level. Over 80% of the 2.6% rise in goods prices came from energy, and freight transport and trade margins pushed services up 0.8%.
How did the dollar react to the PPI report?
Very little. The dollar index rose briefly to about 102.26 after the release, then slipped below 102 within the hour as Treasury yields fell. The 10-year yield closed at 5.10%, its lowest since 22 September.
When is the next US PPI report?
The BLS will publish October producer prices on Friday 13 November 2026 at 8:30 a.m. Eastern time, after the Fed's 28 October decision.
Sources: US Bureau of Labor Statistics: Producer Price Index, September 2026 · US Treasury: daily par yield curve rates · US Bureau of Labor Statistics: Consumer Price Index, September 2026 · Federal Reserve: FOMC meeting calendar
The team behind this guide
Researched, checked and approved by five forex specialists
Every guide is written, fact-checked and edited before it goes live, and updated when the facts change. Spotted an error? Tell us.