IC Markets






































Gold Slips Below $4,000 After Its Worst Week Since June, Even as Real Yields Fall
Futures lost 4.1% to the lowest close since mid-July, and silver fell 5.8%, although the dollar was flat and inflation-adjusted yields dropped.
 WriterAbir KhanWriterWrites the guides · checks every figure against primary sources View profileAbout Abir →

 Market analysisTanbir Habib RiyadForex & Crypto AnalystForex and crypto analyst · technical and fundamental analysis View profileAbout Tanbir →

 Fact-checking & riskJannatul FerdaushFact-Checker & Risk AnalystFact-checks every figure · risk analysis · Applied Statistics, University of Dhaka View profileAbout Jannatul →

 Trading reviewJowel RanaCo-Founder & Forex TraderCo-founder · forex trader · reviews guides from a trader's view View profileAbout Jowel →

 Final approvalRanjan NiskrityFounder, Owner & Forex TraderFounder and owner · forex trader · signs off every guide View profileAbout Ranjan →

Gold ended the week below $4,000 an ounce. Spot gold stood near $3,997 after Friday's close, according to gold-api.com, and COMEX gold futures settled the week at $4,010, down 4.1% from $4,181 a week earlier. That is the lowest futures close since 16 July and the largest weekly fall since the week to 5 June, based on our reading of daily and weekly market data.
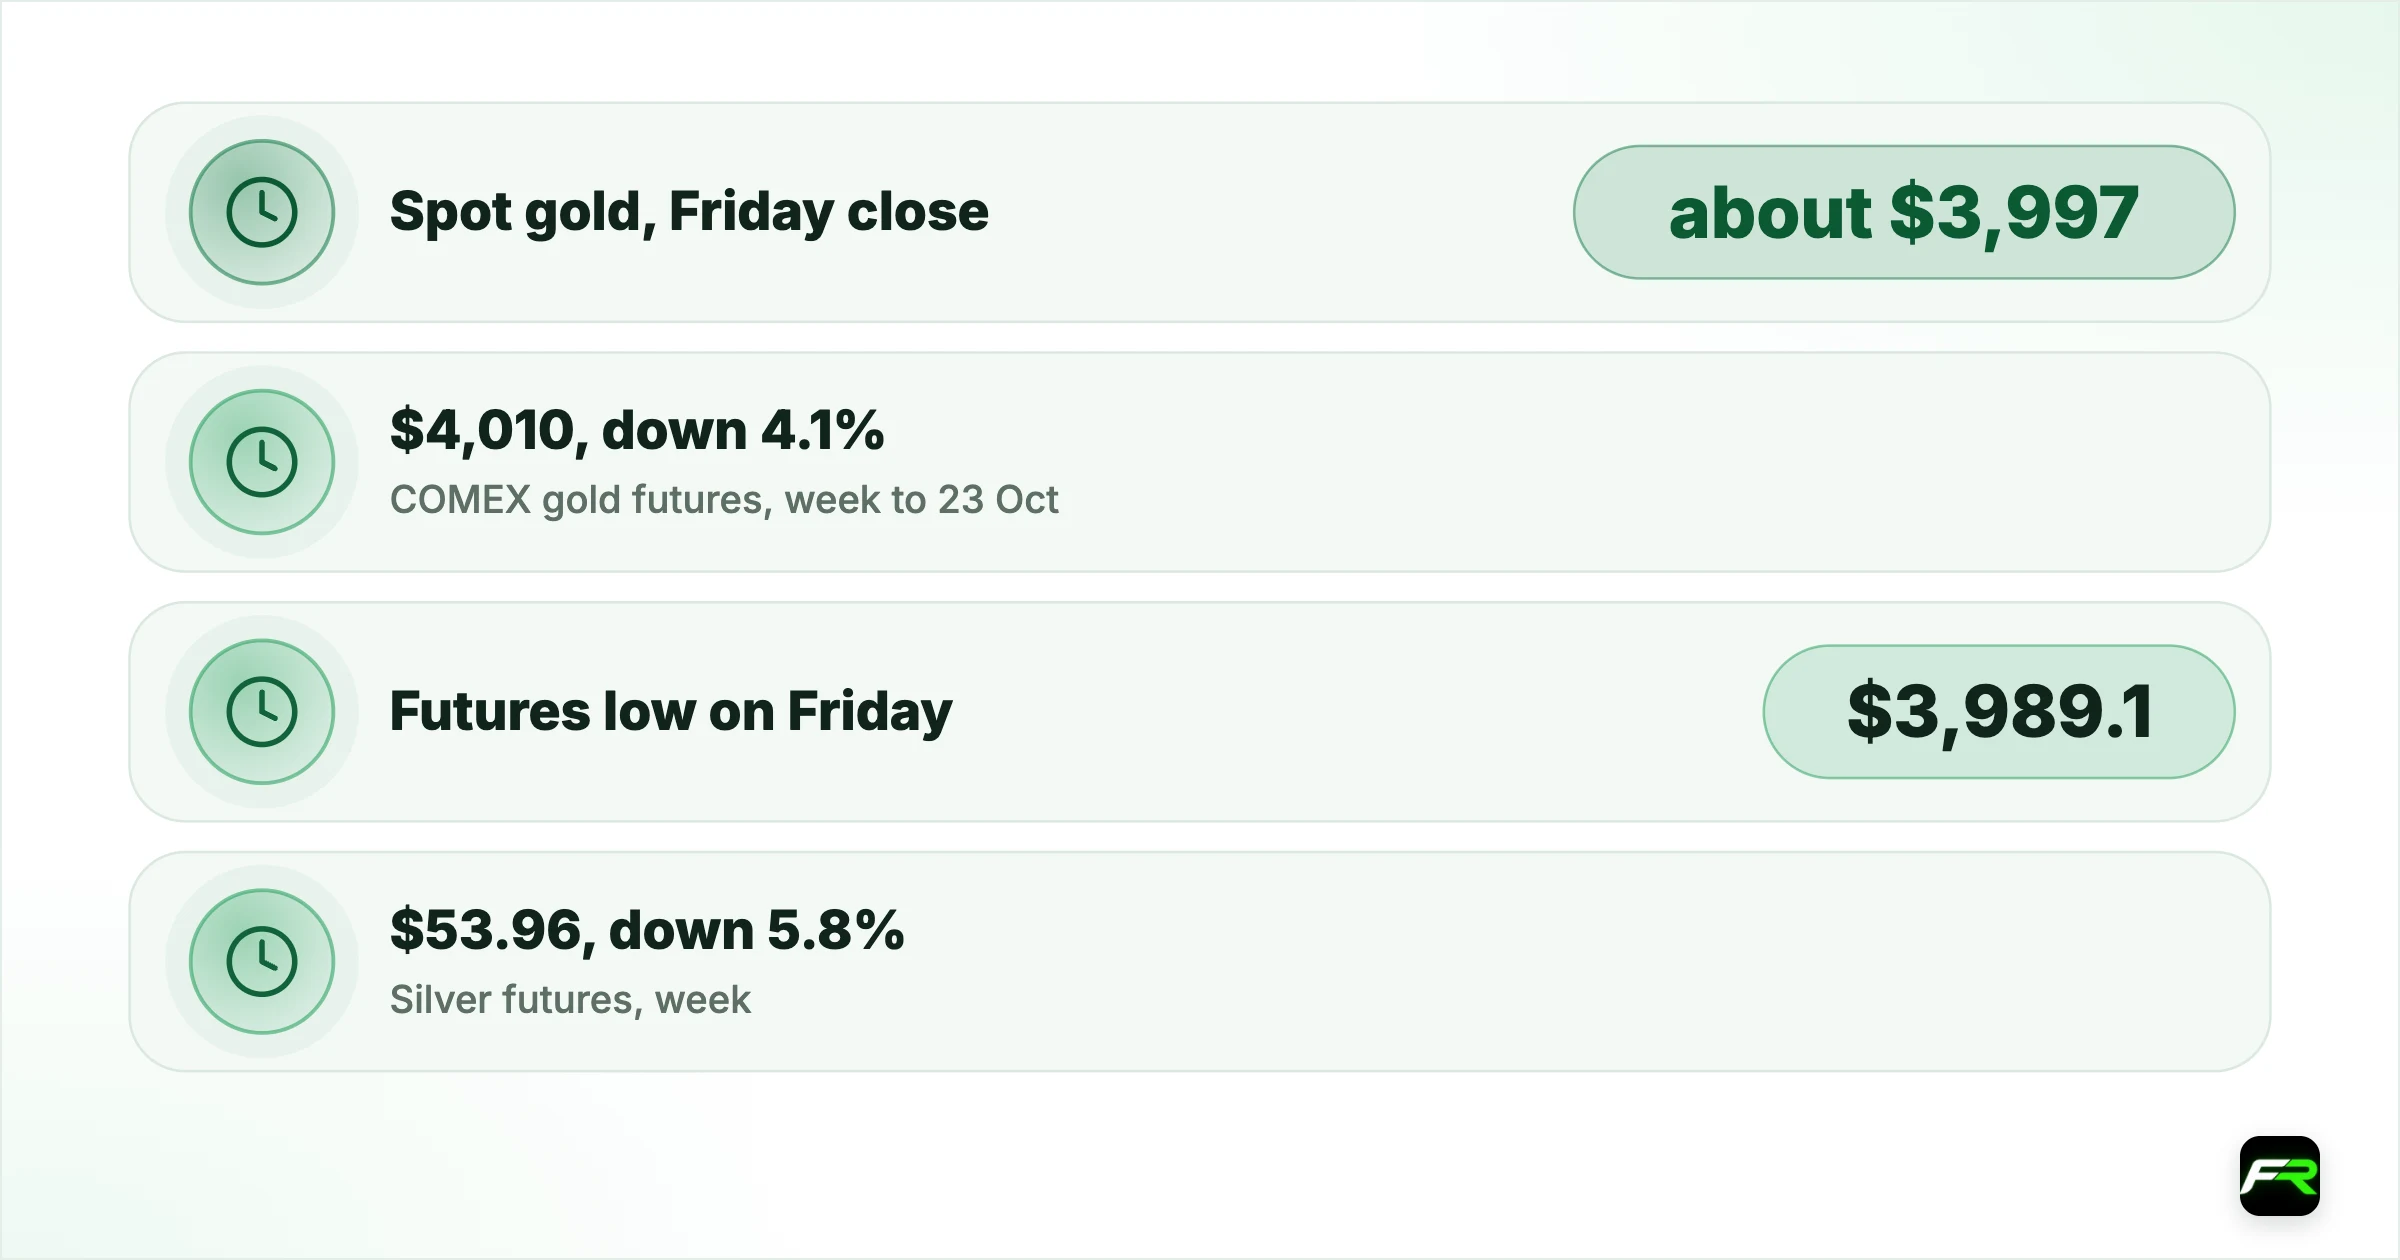
Silver did worse. Futures dropped 5.8% to $53.96, with more than half of that loss on Thursday alone. Both metals fell steadily rather than in one sudden crash, and neither bounced much at the end of the week.
What makes the slide unusual is what did not happen elsewhere. The dollar index finished the week almost unchanged at 101.75. US Treasury yields fell, and the inflation-adjusted yields that gold usually tracks most closely fell too. On the US Treasury's figures, the 10-year real yield dropped to 2.66% on Friday from 2.74% a week earlier. Normally that combination would support gold, not sink it.
| Spot gold, Friday close | about $3,997 (gold-api.com) |
|---|---|
| COMEX gold futures, week to 23 Oct | $4,010, down 4.1% |
| Futures low on Friday | $3,989.1 (14:00 UTC hour) |
| Silver futures, week | $53.96, down 5.8% |
| 10-year real yield (US Treasury) | 2.66%, from 2.74% |
| 10-year nominal yield (US Treasury) | 5.00%, from 5.09% |
| Managed money net long, 20 Oct (CFTC) | 104,206 contracts, down about 2,900 |
How the week unfolded, day by day
Gold opened the week firmly. Futures touched $4,211 in early trading on Monday, the high of the week, before closing the day at $4,152. Tuesday and Wednesday were quiet, with closes of $4,133 and $4,142, and the metal held a band of roughly $4,120 to $4,175.
Thursday did the damage. Futures fell from $4,142 to $4,039, a drop of 2.5%, and they did it hour after hour rather than in one spike. Selling started in the Asian session, when gold slipped from about $4,133 to $4,107, then picked up again in the European afternoon and kept going into the US close. Silver fell 5.2% the same day.
Friday brought the break of $4,000. Futures dipped to $4,005 in the Asian morning and recovered, then fell to $3,989.1 in the 14:00 UTC hour, the lowest price since July. Buyers pushed the price back above $4,000 within the hour, but the metal closed near the bottom of its range at $4,010, down a further 0.7% on the day.
Why falling real yields did not help
Gold pays no interest, so its usual rival is the inflation-adjusted, or real, yield on safe government bonds. When real yields fall, holding gold costs less in lost income, and the price tends to rise. This week broke that pattern. The US Treasury's daily real yield curve shows the 10-year rate falling 0.12 percentage point on Thursday alone, from 2.76% to 2.64%, on the same day gold suffered its worst drop.
Nominal yields fell even further. The 10-year par yield dropped from 5.13% to 4.96% on Thursday, the biggest one-day fall since August 2024 as our yields story reported, before edging back to 5.00% on Friday. That leaves the gap between the two, a rough market gauge of expected inflation, between 2.32% and 2.37% all week, so investors did not suddenly expect lower inflation either.
We could not find an official explanation for the sell-off, and we do not invent one. Our reading is that two forces were at work. Gold had already been falling since late August, when futures closed a week as high as $4,680, so the trend was down and many holders were sitting on shrinking gains. Second, round numbers such as $4,000 tend to gather stop-loss orders, and a slide toward that level can speed up as those orders trigger. That is interpretation, not established fact.
What the CFTC positioning data show
The Commodity Futures Trading Commission's weekly Commitments of Traders report gives an official view of who holds gold futures. Its latest figures, for positions on Tuesday 20 October and published on Friday, show managed money, the category that covers hedge funds and commodity trading advisers, holding 120,970 long contracts and 16,764 short contracts on COMEX. That is a net long position of 104,206 contracts, each covering 100 troy ounces.
Funds had already started to trim before the big fall. Their long positions dropped by 3,777 contracts in the week to 20 October, while shorts fell by 894, cutting the net long by about 2,900 contracts. Total open interest rose by 5,934 to 402,279. Swap dealers, typically banks hedging business with clients, remained the largest short holders with 238,536 contracts.
The report stops on Tuesday, so it does not capture Thursday's or Friday's selling. Next Friday's report, covering Tuesday 27 October, will show whether funds cut their bets sharply as the price broke lower. A large drop in the managed money net long would suggest forced selling, while a stable figure would point to other sellers.
How gold's week compares with other markets
The table compares Friday's close with the close a week earlier. Currencies that often move with commodities, such as the Australian dollar, rose despite the slump in metals, and US crude gained 4% on Friday alone. That divergence suggests the selling was specific to precious metals rather than a broad flight from raw materials.
| Market | Close 16 Oct | Close 23 Oct | Weekly change |
|---|---|---|---|
| Gold futures (COMEX) | $4,181.1 | $4,010.0 | −4.09% |
| Silver futures (COMEX) | $57.31 | $53.96 | −5.84% |
| Dollar index | 101.78 | 101.75 | −0.03% |
| USD/JPY | 157.99 | 156.81 | −0.74% |
| AUD/USD | 0.6949 | 0.7038 | +1.27% |
| 10-year Treasury yield | 5.09% | 5.00% | −0.09 point |
| 10-year real yield | 2.74% | 2.66% | −0.08 point |
UTC candles built from hourly market data, which differ slightly between providers. Yields are the US Treasury's daily par rates.
Levels that matter after the break
Gold now sits on a floor that held several times in late June and July. In five weeks between 22 June and 31 July, futures made weekly lows between $3,955 and $3,994, and each time buyers lifted the price back above $4,000 before the week ended. Friday's low of $3,989 sits inside that zone. A weekly close below about $3,955 would break it, while a return above $4,050, Friday's high, would mean the drop below $4,000 failed.
Above, the first resistance is Thursday's starting point near $4,140, then the week's high at $4,211. From the late-August peak, gold has given up about 14% on a weekly closing basis, so even a bounce of $100 or more would leave the longer trend pointing down.
Next week's calendar is unusually full for gold. The Federal Reserve decides on Wednesday 28 October, the BEA publishes US third-quarter GDP and September PCE inflation on Thursday 29 October, and the Bank of Japan decides on Friday. Our week-ahead preview lists every release with its time.
What it means for gold traders
- Do not assume falling yields will rescue gold. This week showed that the usual link can break for days at a time.
- Watch the $3,955 to $3,995 floor from June and July. A daily close below it would confirm the breakdown; a quick recovery above $4,050 would weaken it.
- Expect wide swings around the Fed on Wednesday at 18:00 UTC and the US data on Thursday at 12:30 UTC. Gold moved more than $100 in a single day this week with no clear trigger.
- Check next Friday's CFTC report for how far funds cut their positions after the break.
- Size trades for gold's larger moves, using the position size calculator, so one loss stays within 1% to 2% of your account.
Say you sell gold at $3,997 with a stop above Friday's high, at $4,055, which is $58 away. One standard lot of XAU/USD is usually 100 ounces, so each $1 move is worth $100 and the stop risks $5,800 per lot. On a $10,000 account with a 1% limit of $100, the right size is under 0.02 lots, where the stop costs about $116, so 0.01 lots (about $58) keeps you inside the limit. Wide stops are fine in gold, as long as the size shrinks to match.
Levels and a trade plan are in our daily gold analysis, which carries Friday's close over the weekend. For the dollar side, see the USD/JPY analysis.
Gold can move sharply when markets reopen after a weekend, and spreads often widen at the Asian open. Leverage magnifies losses as well as gains, so trade only with money you can afford to lose.
Positioning figures are from the Commodity Futures Trading Commission's Disaggregated Commitments of Traders report (futures only) for 20 October 2026. Nominal and real yields are from the US Treasury's daily par yield curves. Gold, silver, currency and oil levels are market data built from hourly bars and differ slightly between providers; spot gold is from gold-api.com. Comparisons with earlier weeks are FX Recap's own calculations, and explanations of the price moves are our reading, not an official view. This is news, not investment advice.
Frequently asked
Why did gold fall below $4,000 this week?
No official cause was given. Futures fell 4.1% in the week to 23 October, with a 2.5% drop on Thursday, even though the dollar was flat and US real yields fell. Our reading is that an existing downtrend and stop-loss selling around $4,000 added to the move.
What was the gold price on 23 October 2026?
COMEX gold futures closed the week at about $4,010 an ounce, after touching $3,989.1, and spot gold was near $3,997 after the close, according to gold-api.com.
Are hedge funds still long gold?
Yes. The CFTC's report for 20 October shows managed money net long 104,206 COMEX gold contracts, down about 2,900 from a week earlier. That data predates the drop on 22 and 23 October.
What could move gold next week?
The Federal Reserve decision on 28 October at 18:00 UTC, US third-quarter GDP and September PCE inflation on 29 October at 12:30 UTC, and the Bank of Japan decision on 30 October.
Sources: CFTC: Disaggregated Commitments of Traders, futures only, 20 October 2026 · US Treasury: daily par real yield curve rates · US Treasury: daily par yield curve rates · Federal Reserve: FOMC meeting calendar · US Bureau of Economic Analysis: release schedule
The team behind this guide
Researched, checked and approved by five forex specialists
Every guide is written, fact-checked and edited before it goes live, and updated when the facts change. Spotted an error? Tell us.