IC Markets

 3:09
 2:39
 2:10
 2:18
 3:43
 8:42





































Treasury Curve Steepens After the Fed Hold: 2-Year Yield Dips to 4.67%, 10-Year Back Above 5%
Short-dated yields slipped and long ones rose on the day the Fed paused, widening the 2s10s gap to 38 basis points, its widest since 19 October.
 WriterAbir KhanWriterWrites the guides · checks every figure against primary sources View profileAbout Abir →

 Market analysisTanbir Habib RiyadForex & Crypto AnalystForex and crypto analyst · technical and fundamental analysis View profileAbout Tanbir →

 Fact-checking & riskJannatul FerdaushFact-Checker & Risk AnalystFact-checks every figure · risk analysis · Applied Statistics, University of Dhaka View profileAbout Jannatul →

 Trading reviewJowel RanaCo-Founder & Forex TraderCo-founder · forex trader · reviews guides from a trader's view View profileAbout Jowel →

 Final approvalRanjan NiskrityFounder, Owner & Forex TraderFounder and owner · forex trader · signs off every guide View profileAbout Ranjan →

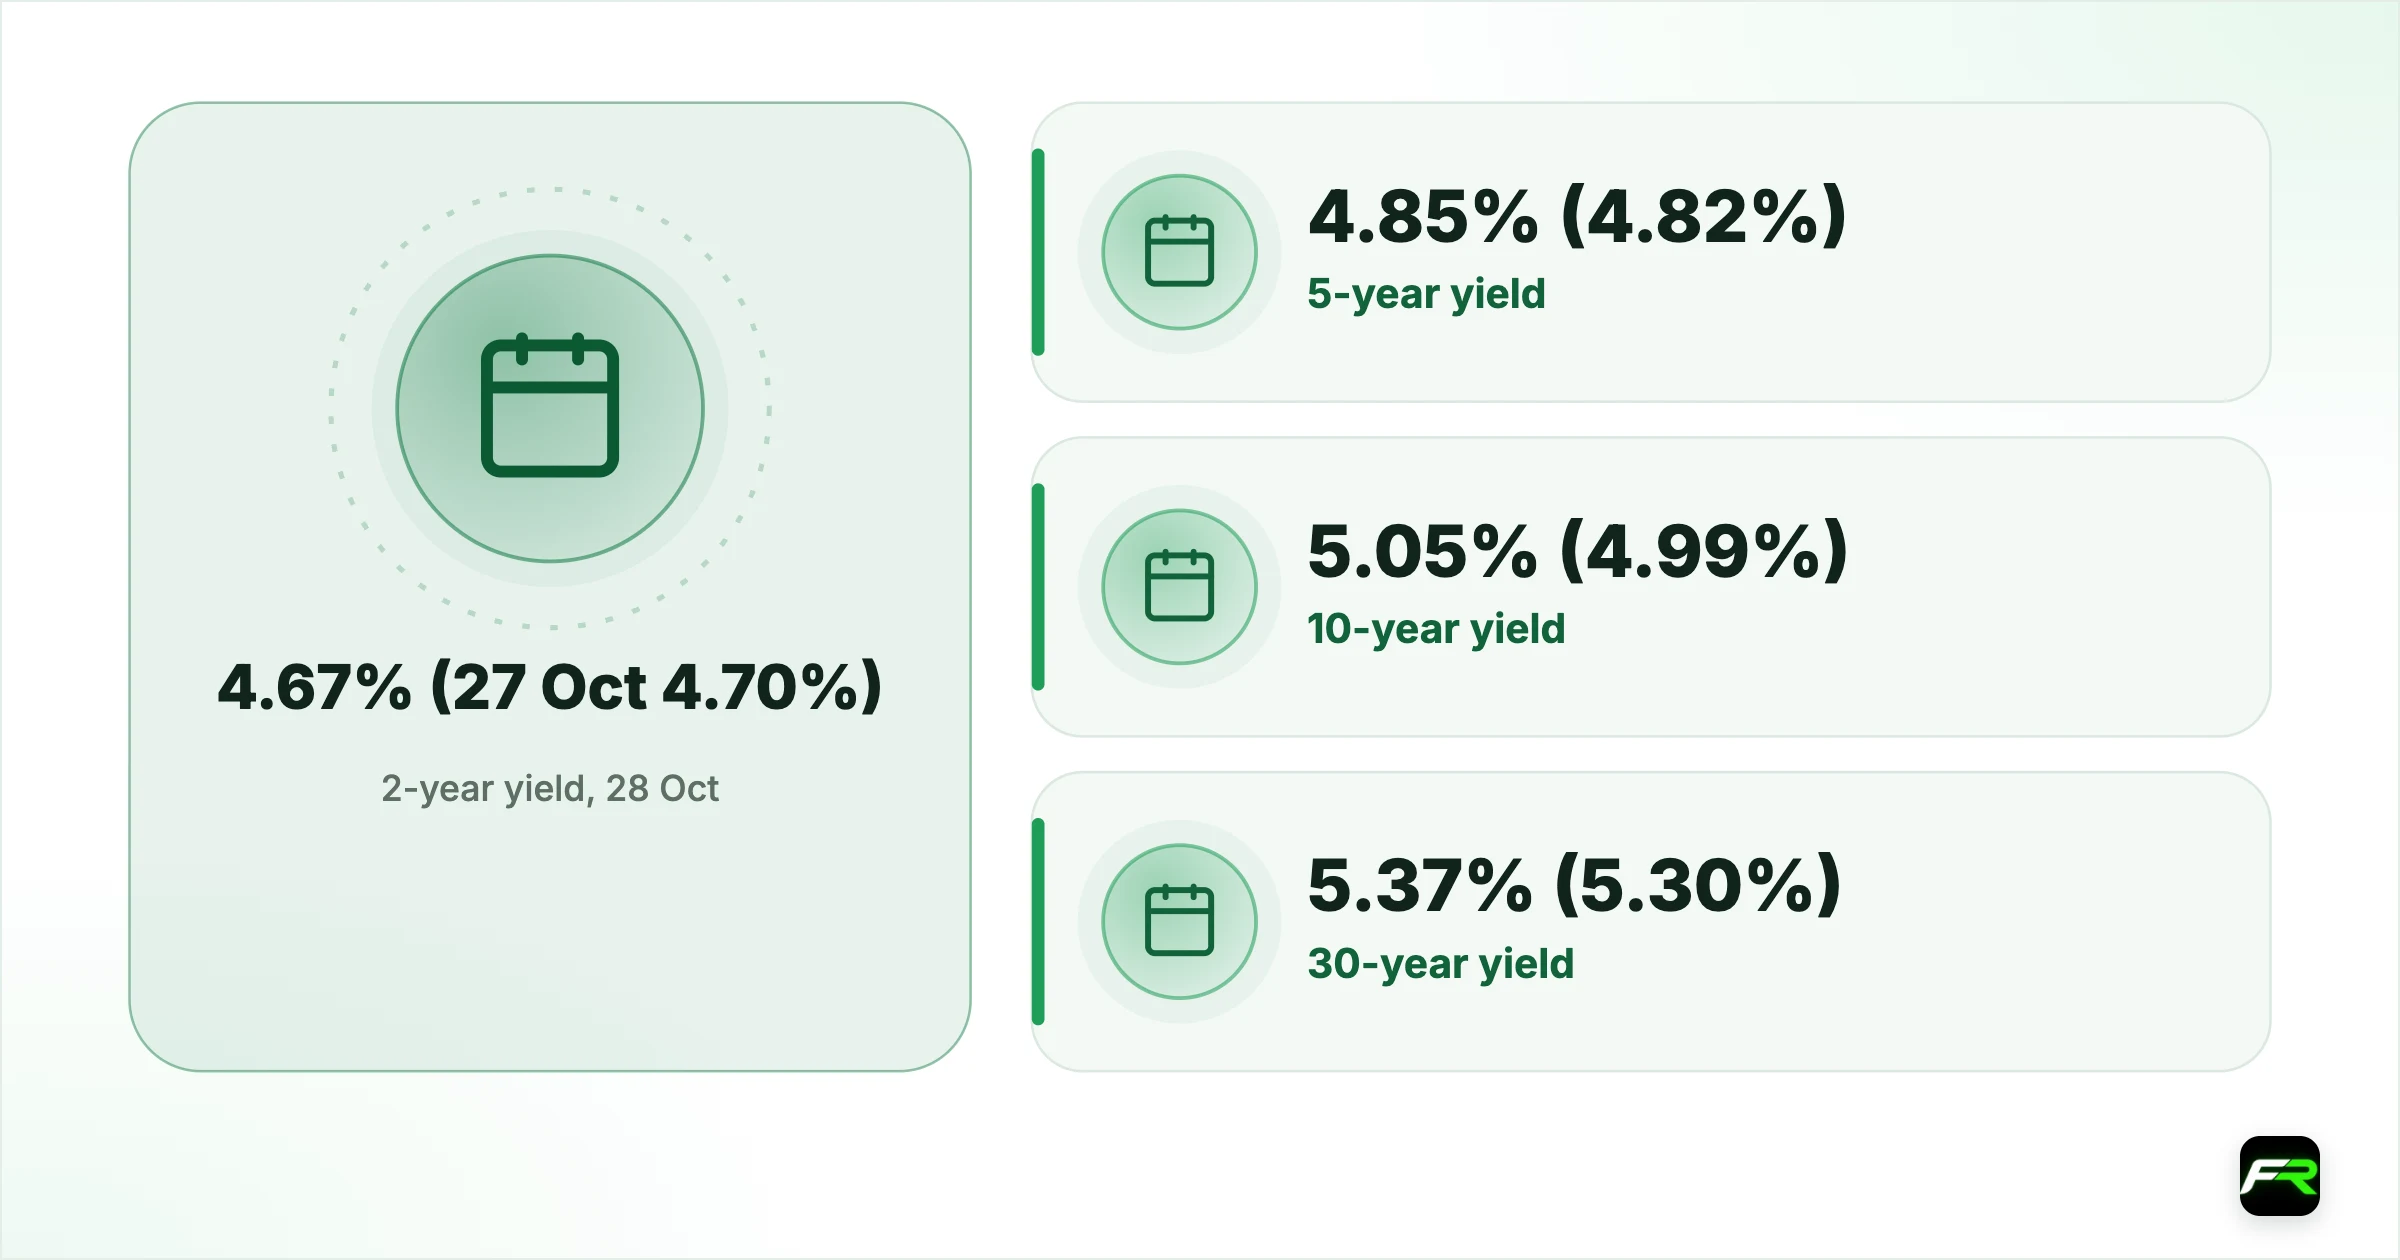
US government bond yields went in opposite directions on Wednesday 28 October, the day the Federal Reserve held its policy rate at 3.75% to 4.00%. According to the US Treasury's daily par yield curve, the 2-year yield fell to 4.67% from 4.70% on Tuesday, while the 10-year rose to 5.05% from 4.99%. The 30-year climbed to 5.37% from 5.30%.
That pattern is called a steepening: the gap between long and short yields widens. The difference between the 10-year and 2-year yields, often called “2s10s”, grew to 38 basis points from 29, its widest close since 19 October. For currency traders, the shape of the US curve matters because short yields track expectations for the Fed, while long ones carry views on inflation, growth and government borrowing.
The Treasury's figures are end-of-day readings, so they show where yields closed, not the path in between. They do not by themselves tell us why yields moved; the explanations below are our own reading of the day's events, clearly marked as such.
| 2-year yield, 28 Oct | 4.67% (27 Oct 4.70%) |
|---|---|
| 5-year yield | 4.85% (4.82%) |
| 10-year yield | 5.05% (4.99%) |
| 30-year yield | 5.37% (5.30%) |
| 3-month bill yield | 4.18% (4.22%) |
| 10-year minus 2-year | 38bp (29bp) |
| 2026 high close, 10-year | 5.31% on 5 October |
| Fed funds target range | 3.75% to 4.00%, held 28 Oct |
How the curve moved on Fed day
Every maturity up to one year fell. The 1-month bill yield slipped to 4.07% from 4.10%, the 3-month to 4.18% from 4.22% and the 1-year to 4.47% from 4.50%. These maturities are anchored by the Fed's own rates: with the target range unchanged and interest on reserve balances kept at 3.90%, according to the Fed's Implementation Note, there was no new step up for bills to price.
From five years out, yields rose. The 5-year closed at 4.85%, the 7-year at 4.95%, the 10-year at 5.05% and the 20-year at 5.41%. Long maturities saw the biggest increases: six basis points on the 10-year and seven on the 20-year and 30-year. That 5-year level also sits close to Tuesday's 5-year note auction, which priced at 4.845%, as our auction story reported.
| Maturity | 27 Oct | 28 Oct | Change |
|---|---|---|---|
| 3-month | 4.22% | 4.18% | -4bp |
| 2-year | 4.70% | 4.67% | -3bp |
| 5-year | 4.82% | 4.85% | +3bp |
| 10-year | 4.99% | 5.05% | +6bp |
| 30-year | 5.30% | 5.37% | +7bp |
Source: US Treasury daily par yield curve rates. Changes are in basis points, where one basis point is 0.01 percentage point.
Why the short end and long end parted
A pause lowers the chance of a rise in the very near term, and that is the simplest reading of the dip in bills and the 2-year. The Fed itself gave no promise either way, saying only that “the accumulation of more information” would guide its next step. Investors who had priced some chance of a move this week had to take it out.
The long end is harder to read. Two of the twelve voters, Lisa D. Cook and Beth M. Hammack, wanted a quarter-point rise, and the statement described growth as “expanding at a strong pace” while inflation “remains elevated.” Chair Kevin Warsh also said energy prices had moved higher again. One reading is that markets saw a central bank willing to wait while inflation stays high, and demanded more yield to hold long bonds. Another is supply: the Treasury sold new 2-year and 5-year notes earlier in the week, and heavy issuance can weigh on bond prices. Both can be true at once, and the Treasury data cannot separate them.
Context helps. The 10-year closed at 5.31% on 5 October, its highest close of 2026, then fell as low as 4.96% on 22 October before Wednesday's rebound. On 16 September, the day of the Fed's last rise, the 2-year stood at 4.74% and the 10-year at 5.01%, so the curve is steeper now than after that hike.
Why yields matter for the dollar
Currency traders tend to watch the 2-year most closely, because it moves with expected Fed rates and so with the interest-rate gap against other countries. A small dip in the 2-year after a pause is a mild negative for the dollar. Rising long yields can cut the other way, attracting overseas buyers of Treasuries, though they also raise borrowing costs across the economy.
USD/JPY is the pair most sensitive to US yields, because Japanese yields are so much lower. The ECB reference rate for USD/JPY, derived as a cross, was 157.96 on Wednesday, set around 13:15 UTC, before the Fed. On Friday 30 October the Bank of Japan announces its own decision, and that can shift the rate gap from the Japanese side.
EUR/USD responds more to the 2-year gap between US and German yields. With the ECB deciding on Thursday at 13:15 UTC, any change in euro area yields will feed directly into that spread within hours of the US data.
What the Fed's own rates tell bond traders
Short-dated yields rarely stray far from the rates the Fed sets directly. The Implementation Note keeps the overnight reverse repo offering rate at 3.75%, the bottom of the target range, and the standing repo rate at 4.0%, the top. Interest on reserve balances sits at 3.90%. Those three numbers form a corridor for overnight money, and bill yields between 4.07% and 4.32% sit above its top. In our reading, that is consistent with markets keeping some chance of a higher range in view over the coming months.
The desk at the New York Fed will also keep buying Treasury bills, and if needed other Treasuries with up to three years to maturity, to keep reserves ample. Those purchases support the very short end of the curve. They do not reach 10-year or 30-year bonds, which is one reason long yields can rise even while bills are steady.
What it means for traders
A steeper curve after a Fed pause is not a trading signal in itself, but it shapes how the dollar may respond to the next data. Thursday brings the first estimate of third-quarter GDP and the September PCE price index from the Bureau of Economic Analysis at 12:30 UTC. Strong figures could push short yields back up and revive talk of a December hike; weak ones could extend the steepening.
- Watch the 2-year yield first. A move back above 4.70% would suggest markets are pricing December more firmly after the data.
- Keep an eye on the 10-year near 5%. It has closed on both sides of that line in the past week, and a sustained rise towards the 5.31% October high would tighten financial conditions further.
- Expect USD/JPY to react most to yield moves, and remember that Friday's Bank of Japan decision adds its own risk.
- Treasury auctions continue: check the Treasury's calendar for the next sales, which can move yields on the day.
- Read our Fed decision story for the full statement and the dissents.
Suppose you buy USD/JPY at 158.00, expecting strong US data to lift short yields, with a stop at 157.40, 60 pips away. One pip on 10,000 units is 100 yen, about $0.63 at that price, so the stop costs about $38 per 10,000 units. On a $4,000 account with a 1% limit of $40, around 10,500 units fits. If the Bank of Japan surprises on Friday, the pair can gap past your stop, so close or reduce before the announcement if you cannot watch it. The <a href="/position-size-calculator">position size calculator</a> helps.
Daily levels are on our USD/JPY analysis and EUR/USD analysis pages. For background on the yield story this month, see our 23 October yields story.
Bond yields and currencies can move quickly around central bank decisions and data releases. Leverage magnifies losses as well as gains, so trade only with money you can afford to lose.
Yields come from the US Treasury's daily par yield curve rates for 27 and 28 October 2026 and earlier dates. The decision, vote and quoted wording come from the Federal Reserve's statement and Implementation Note of 28 October 2026. The USD/JPY rate is derived from ECB euro reference rates. The explanations of the move are FX Recap's own analysis. This is news, not investment advice.
Frequently asked
What were US Treasury yields on 28 October 2026?
According to the US Treasury, the 2-year yield closed at 4.67%, the 10-year at 5.05% and the 30-year at 5.37% on 28 October 2026, the day of the Fed's decision.
What does a steepening yield curve mean?
It means long-term yields rise relative to short-term ones. On 28 October the gap between the 10-year and 2-year yields widened to 38 basis points from 29.
Why did short-term yields fall after the Fed decision?
The Fed held its target range at 3.75% to 4.00%, so there was no new rise for bills and 2-year notes to price. The Fed said more information would guide its next step.
How do Treasury yields affect currencies?
Short-term yields track expected Fed rates and so the interest-rate gap with other countries. A higher US 2-year yield tends to support the dollar, especially against the yen.
Sources: US Treasury: daily par yield curve rates · Federal Reserve: FOMC statement, 28 October 2026 · Federal Reserve: Implementation Note, 28 October 2026 · European Central Bank: euro foreign exchange reference rates
The team behind this guide
Researched, checked and approved by five forex specialists
Every guide is written, fact-checked and edited before it goes live, and updated when the facts change. Spotted an error? Tell us.