 IC Markets
 3:09
 2:39
 2:10
 2:18
 3:43
 8:42





















Sell the bounce
- Entry
- 1.1175–1.1185
- Stop
- 1.1220
- TP 1
- 1.1130
- TP 2
- 1.1100
Risk : reward1:1.3–2.0
Possible gain50–80 pips

Market radar Checking the sessions…
Browser alerts
Your pairs and rate decisions, max 2 a day
FX Recap videos55 free videos
SubscribeDaily analysis
All technical analysis →Currency forecasts
Market data
Broker reviews
 IC Markets
 XM
 Exness
 FP Markets
 AvaTrade
 RoboForex
 LiteFinance
 IUX Markets
 FXTM
 Tickmill
 Vantage Markets
 Fusion Markets
 Elev8
 Pepperstone
Most compared
XM vs ExnessExness vs IC MarketsXM vs IC MarketsIC Markets vs FP MarketsRoboForex vs IC MarketsExness vs AvaTradePopular matchups
XM vs AvaTradeExness vs RoboForexAvaTrade vs FP MarketsIC Markets vs LiteFinanceXM vs RoboForex Exness vs IUX
More head-to-heads
Exness vs FP MarketsRoboForex vs FP MarketsXM vs FP MarketsAvaTrade vs IC MarketsRoboForex vs LiteFinanceAvaTrade vs RoboForexAsia
Africa
 Forex in South AfricaBest SA brokersKenya CMA brokersM-Pesa brokersForex legal in Nigeria?Forex tax in KenyaMarket hours in Nigeria
United Kingdom
Forex basics
Analysis & strategy
Topic guides
Prop trading
Trade calculators
All trade calculators →Risk & planning
All planning tools →Market data
Find & practise
All broker tools →ECB reference 1.1133▼ −17 pips · −0.15% vs previous
Next: US GDP and PCE inflation · Thu 29 Oct
Live quote by TradingView. Chart, levels and stats use daily reference prices (ECB rates of 28 Oct, gold 03:43 UTC). Educational content, not financial advice.
 WriterAbir KhanWriterWrites the guides · checks every figure against primary sources View profileAbout Abir →

 Market analysisTanbir Habib RiyadForex & Crypto AnalystForex and crypto analyst · technical and fundamental analysis View profileAbout Tanbir →

 Fact-checking & riskJannatul FerdaushFact-Checker & Risk AnalystFact-checks every figure · risk analysis · Applied Statistics, University of Dhaka View profileAbout Jannatul →

 Trading reviewJowel RanaCo-Founder & Forex TraderCo-founder · forex trader · reviews guides from a trader's view View profileAbout Jowel →

 Final approvalRanjan NiskrityFounder, Owner & Forex TraderFounder and owner · forex trader · signs off every guide View profileAbout Ranjan →

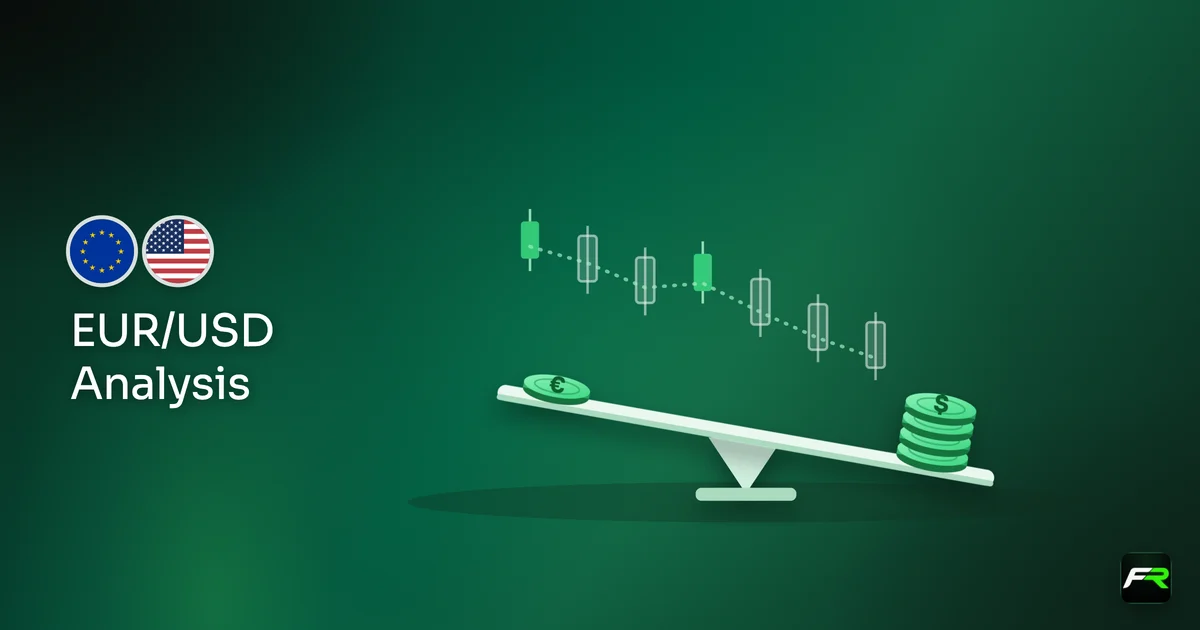
EUR/USD's ECB reference rate was 1.1133 on Wednesday 28 October, 17 pips below Tuesday's 1.1150 and the lowest reference rate of 2026 for a second day. The pair is 74 pips under its 20-day average (1.1207) and about 280 pips under the 50 and 100-day averages near 1.1415 to 1.1440. The 14-day RSI on the reference rates is about 30, at the edge of oversold. The rate was set before the Fed held its range on Wednesday evening; the ECB decides today at 13:15 UTC.
1Wednesday's 1.1133 is a second straight 2026 low.
2The broken 1.1180 zone is now the first resistance.
3US GDP, PCE and the ECB today; RSI near 30.
Both widgets update in real time, so they may differ from the levels written at ECB rates of 28 Oct, gold 03:43 UTC.
Distance is measured from the price at ECB rates of 28 Oct, gold 03:43 UTC.
Three setups for the rest of the week. One sells a bounce into the broken 1.1175 to 1.1185 zone, another sells a further close below 1.1120, and the third buys a close back above 1.1215. US GDP and PCE inflation land at 12:30 UTC today and the ECB decides 45 minutes later, so expect sharp swings in both directions. With the RSI near 30, a short-covering bounce is possible before the next leg.
The levels come from daily reference rates, not intraday highs and lows, so allow a few pips either side and check the live chart before you enter. Size each setup so a stop-out costs no more than 1% to 2% of your account; the position size calculator does the maths.
| Market Bias | Entry Zone | Stop Loss | Take Profit 1 | Take Profit 2 | Risk Reward | Possible Gain (pips) |
| Bearish | 1.1175–1.1185 | 1.1220 | 1.1130 | 1.1100 | 1:1.3–2.0 | 50–80 |
| Bearish | Below 1.1120 (close) | 1.1160 | 1.1080 | 1.1050 | 1:1.0–1.8 | 40–70 |
| Bullish | Above 1.1215 (close) | 1.1175 | 1.1255 | 1.1300 | 1:1.0–2.1 | 40–85 |
Strong US data after a Fed hold with two hawkish dissents, or a cautious ECB, could extend the slide. A close below 1.1120 would open 1.1080, then 1.1050. The scenario fails on a close above 1.1215.
If the ECB sounds firm about inflation and US data disappoint, the pair could reclaim 1.1180 and close above 1.1215, targeting 1.1255, then 1.1300. Below that, rallies stay corrections inside the downtrend.
On the ECB's daily reference rates, EUR/USD is still in a downtrend. The 60-day high was 1.1699 and the rate has since made lower highs: 1.1269 on 6 October, 1.1253 on 16 October and 1.1234 on 21 October. Wednesday's 1.1133 sits under the 20-day average (1.1207) and far below the 50-day (1.1414) and 100-day (1.1440), so every rally this month has been sold.
The floor at 1.1177 to 1.1181, the swing lows of 7 and 12 October, broke on Tuesday and the rate fell further on Wednesday. Broken support often turns into resistance, so that zone is now the first cap above the rate. A close below 1.1120 would extend the slide towards 1.1080 and 1.1050, while a reference rate back above 1.1215, over the 20-day average, would turn this week's drop into a false break and open 1.1255 to 1.1300. Our support and resistance guide explains how to read these turning points.
Over the last seven working days the EUR/USD reference rate fell from 1.1225 to 1.1133, a net loss of 92 pips, with one rise and six falls. The only gain was 19 pips on 21 October, to 1.1234. Tuesday's 38-pip drop was the biggest of the period, ahead of 29 pips on 22 October, and Wednesday's 17-pip fall left the rate at 1.1133, the lowest of the seven days and of 2026.
| Date | Reference rate | Change |
| Tue 20 Oct | 1.1215 | −10 pips (−0.09%) |
| Wed 21 Oct | 1.1234 | +19 pips (+0.17%) |
| Thu 22 Oct | 1.1205 | −29 pips (−0.26%) |
| Fri 23 Oct | 1.1193 | −12 pips (−0.11%) |
| Mon 26 Oct | 1.1188 | −5 pips (−0.04%) |
| Tue 27 Oct | 1.1150 | −38 pips (−0.34%) |
| Wed 28 Oct | 1.1133 | −17 pips (−0.15%) |
| 7-day range | 1.1133 to 1.1234 | −92 pips (−0.82%) |
Wednesday brought two rate decisions after Europe's reference rates were set. The Bank of Canada raised its policy rate to 2.5%, its first increase since July 2023, and the Federal Reserve held its range at 3.75% to 4.00% in a 10-2 vote, with Lisa Cook and Beth Hammack voting for a quarter-point rise. On the US Treasury's par curve, the 2-year yield slipped to 4.67% and the 10-year rose to 5.05%. Today brings US third-quarter GDP and September PCE inflation at 12:30 UTC and the ECB decision at 13:15 UTC, with the Bank of Japan on Friday. Prices on this page are official reference rates from Wednesday 28 October, set before both decisions; the live chart shows where the market trades now. For EUR/USD, euro area inflation rose to 3.8% in September; our ECB preview sets out what today could bring, and our Fed decision story covers Wednesday's hold.
Energy prices remain the main outside force on the euro. Europe imports most of its energy, so higher oil and gas weigh on its economy, while they also lift US inflation. The ECB's own September account named gas supply and a cold winter as upside risks to inflation. Until energy costs ease, rallies in the euro are likely to meet sellers below 1.1255.
The bias stays bearish below 1.1190 after two straight 2026 lows, the latest at 1.1133. Selling a bounce into the broken 1.1180 zone is the cleaner trade; a close below 1.1120 would keep sellers in charge, and a close above 1.1215 would switch the bias to bullish. Today's US data and ECB decision will decide whether the break extends.
Two new lows in two days and an RSI at 30. The trend is clearly down, but the move is stretched, and an ECB surprise could spark a sharp squeeze, so I would rather sell a bounce than chase.
“I would sell 1.1175 to 1.1185 with a stop above 1.1220, looking for 1.1130 and then 1.1100. A close back above 1.1215 would tell me the break has failed.”
Tanbir Habib Riyad, Forex & Crypto Analyst, FX Recap
For traders working through today’s setup, these guides cover the concepts used in this EURUSD Technical Analysis:
Follow FXRecap on YouTube for quick, chart-based analysis of gold, forex majors, indices, and major market moves: https://www.youtube.com/@fxrecap
This analysis is for educational purposes only and does not constitute personalized financial advice. Trading involves risk, and past chart behavior does not guarantee future results.
Source for the ECB’s current policy rates: European Central Bank — Key ECB Interest Rates
The team behind this guide
Researched, checked and approved by five forex specialists
Every guide is written, fact-checked and edited before it goes live, and updated when the facts change. Spotted an error? Tell us.
 Technical AnalysisGBP/USD Analysis Today: Pound Falls to 1.3288, Down to the 20-Day Average After a Fifth DipGBP/USD worked out at 1.3288 on Wednesday's ECB reference rates, a fifth dip from the 1.3402 high, on the 20-day average. Neutral from 1.3275 to 1.3410. Levels and a recap.Abir Khan29 October 2026
 Technical AnalysisUSD/JPY Analysis Today: Pair at 157.96, Level With the 20-Day Average Before the BoJUSD/JPY worked out at 157.96 on Wednesday's ECB reference rates, a third rise that met the 20-day average. Neutral from 157.45 to 158.25. Levels and a recap.Abir Khan29 October 2026
 Technical AnalysisGold Analysis Today: XAU/USD Spot Steady at $4,045 After the Fed Hold, Just Under $4,050Spot gold was $4,045.2 at 03:43 UTC on Thursday (gold-api.com), up $1.70 after the Fed held rates, the highest in our log. Neutral above $4,000. Levels and our spot log.Abir Khan29 October 2026