 IC Markets




































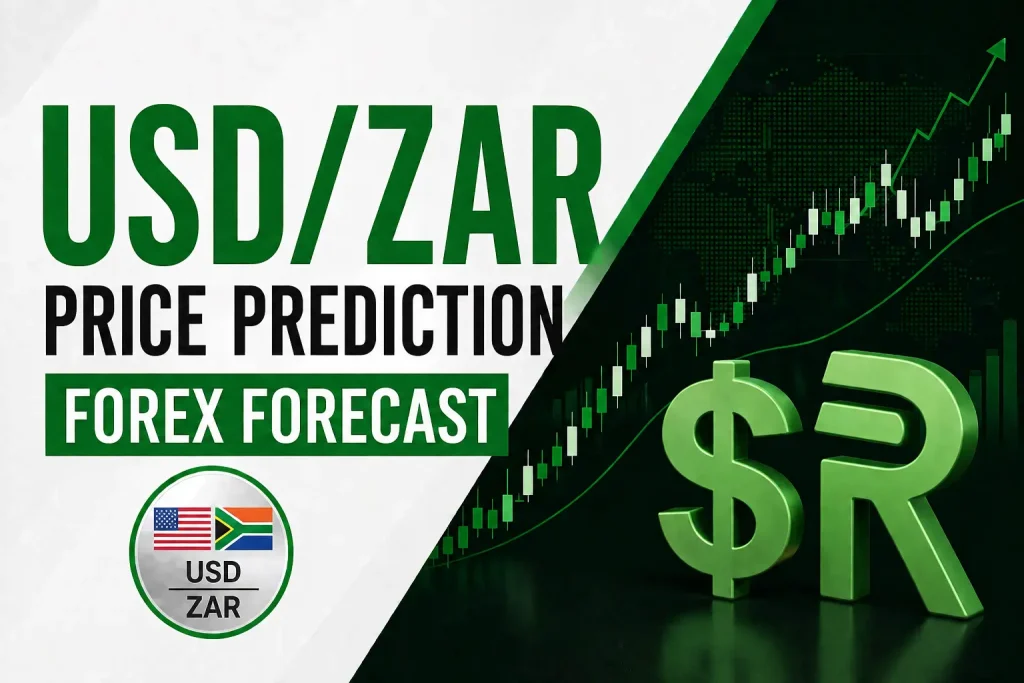
USD/ZAR Price Prediction Chart
Live USD/ZAR price, charts, and a 30-day forecast range, plus technical buy/sell signals to help you track the US Dollar/South African Rand trend.
 WriterAbir KhanWriterWrites the guides · checks every figure against primary sources View profileAbout Abir →
 Market analysisTanbir Habib RiyadForex & Crypto AnalystForex and crypto analyst · technical and fundamental analysis View profileAbout Tanbir →
 Fact-checking & riskJannatul FerdaushFact-Checker & Risk AnalystFact-checks every figure · risk analysis · Applied Statistics, University of Dhaka View profileAbout Jannatul →
 Trading reviewJowel RanaCo-Founder & Forex TraderCo-founder · forex trader · reviews guides from a trader's view View profileAbout Jowel →
 Final approvalRanjan NiskrityFounder, Owner & Forex TraderFounder and owner · forex trader · signs off every guide View profileAbout Ranjan →
USD/ZAR live chart
US Dollar / South African Rand, real-time priceUSD/ZAR technical meter
Live buy/sell read from 24 indicatorsOscillators
Moving averages
See all 24 indicators
| Indicator | Value | Signal |
|---|
USD/ZAR 30-day forecast range
Based on how much USD/ZAR has moved over the last 60 trading days, there is roughly a two-in-three chance that USD/ZAR trades between R16.020 and R17.027 over the next 30 days, about 3.0% either side of today’s R16.516. Widen that to R15.558 to R17.532 for a 95% range.
Forecast range by horizon
| Horizon | Bearish (68% low) | Base | Bullish (68% high) | 95% range |
|---|---|---|---|---|
| 1 week | R16.272 | R16.516 | R16.763 | R16.041 to R17.004 |
| 1 month | R16.020 | R16.516 | R17.027 | R15.558 to R17.532 |
| 3 months | R15.666 | R16.516 | R17.411 | R14.892 to R18.316 |
How we work this out: the range uses USD/ZAR’s daily price swings over the last 60 trading days and assumes no particular direction, so the base case is today’s price. It tells you how far the market normally travels, not where it will go. A central bank surprise or a shock headline can push price outside even the 95% band. Updated 6 October 2026.
USD/ZAR technical levels and performance
USD/ZAR trades above all three of its 20, 50 and 200-day moving averages, with a 14-day RSI of 64 (neutral). Over the past 30 days it has ranged from R15.939 to R16.747.
Performance
Levels and performance use daily closes up to 6 October 2026. The live chart and meter above update in real time.
What moves USD/ZAR
The rand doesn’t behave like the euro or the pound. It’s an emerging market currency tied to what South Africa digs out of the ground and how brave global investors are feeling. Learn these five forces and the rand’s wild days start making sense.
Gold down → USD/ZAR up
Panic → USD/ZAR spikes
Fed hawkish → USD/ZAR up
Domestic trouble → USD/ZAR up
Oil down → USD/ZAR down
The central banks behind USD/ZAR
USD/ZAR is a straight read on the policy gap between two central banks. Knowing what each one is trying to do, and who's currently running it, explains a lot of what shows up on the chart.
Federal Reserve (Fed)
The Federal Reserve is the central bank of the United States, created by the Federal Reserve Act of 1913. It answers to a dual mandate set by Congress: keep inflation stable, which it defines as 2% over time, and support maximum sustainable employment. The Federal Open Market Committee sets the target range for the federal funds rate at eight scheduled meetings a year, and because so much of world trade and reserve holdings are priced in dollars, that single decision moves markets well beyond America's own borders.
Kevin Warsh has chaired the Fed since May 2026, after the Senate confirmed him for a four-year term running to May 2030. Born in Albany, New York, in April 1970, he trained as a lawyer at Harvard and worked in mergers and acquisitions at Morgan Stanley before George W. Bush brought him into the White House as a special assistant on economic policy. He first served on the Fed's own Board of Governors from 2006 to 2011, including as the Fed's representative to the G20, then spent over a decade at Stanford's Hoover Institution before returning to lead the Fed.
South African Reserve Bank (SARB)
The South African Reserve Bank has been South Africa's central bank since 1921, making it one of the oldest central banks outside Europe and North America. Its constitutional job is to protect the value of the rand, which it pursues through inflation targeting; from 2025 that target moved from a 3-6% range to a tighter 3% point target with one percentage point of room either side. Because South Africa's markets sit more exposed to shifts in global risk appetite than most developed economies, SARB decisions tend to carry extra weight for the rand beyond the rate change itself.
Lesetja Kganyago has governed the SARB since November 2014 and is now serving his third five-year term, which runs to November 2029. He came to the role from South Africa's National Treasury and has since steered the Bank through the 2020 pandemic shock, a multi-year rate-hiking cycle and 2025's move to a lower inflation target, making him one of the longest-serving central bank governors among major emerging markets today.
How to trade USD/ZAR
The rand is a classic risk-sensitive emerging-market currency: when global investors feel confident, money flows into higher-yielding assets like South African bonds and the rand strengthens; when risk appetite sours, that money flows back out fast and USD/ZAR spikes. It's one of the more reliable currencies to watch as a pure gauge of global risk sentiment, precisely because it reacts so visibly to it.
Reading the meter above
The gauge above condenses a set of moving averages and oscillators on the interval you select into one read: strong sell, sell, neutral, buy or strong buy. On a currency this sensitive to global risk swings, a technical reading can flip quickly around any shift in broader market sentiment, not just South African news, so treat it as one input rather than the whole picture.
What correlates with USD/ZAR
South Africa's export economy leans heavily on precious metals, gold and platinum group metals in particular, so a rising gold price genuinely supports the rand through real export revenue, not just sentiment. Local factors matter just as much: electricity supply issues, political developments and South African Reserve Bank rate decisions all move USD/ZAR independently of anything happening in Washington.
The most common mistake
Overnight USD/ZAR positions carry a cost many traders forget to check first: the swap, or rollover, fee. The interest rate gap between the US and South Africa is wide enough that carrying a position, a short-dollar, long-rand trade especially, can cost noticeably more in swap fees over a week than most traders expect, eating directly into the trade's actual profit.
Where USD/ZAR stands in 2026
The rand has quietly been one of the better-performing currencies of the past year. USD/ZAR has fallen from its all-time high near 19.93 in April 2025 to the low 16s, meaning the rand has gained roughly 8% against the dollar over twelve months. The tailwinds lined up nicely: gold and platinum prices hit records, pouring export income into South Africa, and the Reserve Bank kept rates high, even delivering its first hike in three years in May 2026 to fight the inflation from the Middle East oil shock. High local rates plus booming metal exports is about as good as it gets for the rand.
The pair has spent recent months chopping between roughly 16 and 17 as those tailwinds fight a stubborn headwind: the US Fed has stayed hawkish, keeping the dollar firm against everything. Analysts are split along that fault line. Those expecting USD/ZAR to grind lower toward the 15s point to strong metal prices and the wide rate gap in the rand’s favour. Those expecting a bounce back toward 17 or higher point to the firm dollar and South Africa’s unresolved issues at home, from electricity supply to trade access questions with the US. Either way, expect the journey to be bumpy; this pair rarely travels in straight lines.
October 2026 update
USD/ZAR trades near R16.52 on 6 October, up 1.8% from early July (R16.22) and 3.4% higher over the past month as the dollar firmed against most currencies. It remains inside the R16 to R17 band it has held for months.
The South African Reserve Bank’s repo rate is 7.25% and the Fed’s target range 3.75% to 4.00%, so the rand still carries a yield advantage of more than three percentage points. The next Fed decision is on 28 October.
Background figures date from July 2026; the October update uses market data as of 6 October 2026 and central bank rates as published in late September. Analyst views are opinions, not guarantees.
USD/ZAR trading FAQs
What does USD/ZAR mean?
It’s the price of one US dollar measured in South African rand. A rate of 16.23 means one dollar buys about 16 rand. When the rate rises, the dollar is strengthening and the rand is weakening; when it falls, the rand is gaining ground.
Why is the rand called a “risk barometer”?
The rand is one of the most liquid emerging market currencies and trades around the clock, so global investors use it as a quick way to bet on or against risky assets in general. That’s a mixed blessing: the rand often moves on world events that have nothing to do with South Africa, simply because it’s the easiest emerging market currency to trade.
What is the carry trade?
It’s borrowing money in a low-interest currency, like the dollar, and parking it in a high-interest one, like the rand, to pocket the difference. With South African rates around 7% and US rates under 4%, the gap is attractive. The catch: carry trades work in calm markets and unwind violently in scared ones, which is why USD/ZAR can spike suddenly during global stress.
Why did USD/ZAR fall from nearly 20?
Mostly rand strength rather than dollar weakness. Gold and platinum, South Africa’s flagship exports, surged to record prices, bringing in export income. At the same time the Reserve Bank kept rates high and even hiked in May 2026, making the rand rewarding to hold. Those two forces pulled the pair from its 19.93 peak down into the 16s.
How volatile is USD/ZAR compared to major pairs?
Very. Daily moves of 1-2% are routine, and a SARB or Fed announcement can move the pair hundreds of pips in half an hour. Spreads are also wider than on EUR/USD, meaning each trade costs more. If you’re new, trade smaller positions than you would on a major pair, always use a stop loss, and avoid holding through rate announcements.
Can I rely on the forecast on this page?
Use it as one input, not a plan. The projection shows a statistically likely range based on recent volatility. It doesn’t know about tomorrow’s Fed comment, a gold price swing, or a headline out of South Africa. No forecast does, and this pair is especially headline-sensitive. Combine it with your own analysis and strict risk limits.
Explore more markets
Every market below has its own page just like this one, with a live chart, a forecast range, and buy/sell signals. Pick a pair to see where it’s heading, or open today’s analysis for ready-made trade setups.
The team behind this guide
Researched, checked and approved by five forex specialists
Every guide is written, fact-checked and edited before it goes live, and updated when the facts change. Spotted an error? Tell us.
Related Articles
 Currency Forecast
11 min read
Currency Forecast
11 min read

 Currency Forecast
11 min read
Currency Forecast
11 min read
 Currency Forecast
11 min read
Currency Forecast
11 min read
 Currency Forecast
11 min read
Currency Forecast
11 min read
 Currency Forecast
9 min read
Currency Forecast
9 min read
 Currency Forecast
9 min read
Currency Forecast
9 min read