IC Markets






































US Housing Starts Fell 5.2% in September as Builders Slowed Ahead of the Fed
Builders broke ground on fewer homes while permits held near 1.4 million, a soft signal from a sector exposed to 5% Treasury yields.
 WriterAbir KhanWriterWrites the guides · checks every figure against primary sources View profileAbout Abir →

 Market analysisTanbir Habib RiyadForex & Crypto AnalystForex and crypto analyst · technical and fundamental analysis View profileAbout Tanbir →

 Fact-checking & riskJannatul FerdaushFact-Checker & Risk AnalystFact-checks every figure · risk analysis · Applied Statistics, University of Dhaka View profileAbout Jannatul →

 Trading reviewJowel RanaCo-Founder & Forex TraderCo-founder · forex trader · reviews guides from a trader's view View profileAbout Jowel →

 Final approvalRanjan NiskrityFounder, Owner & Forex TraderFounder and owner · forex trader · signs off every guide View profileAbout Ranjan →

Construction began on fewer American homes in September. Housing starts ran at a seasonally adjusted annual rate of 1,221,000, the Census Bureau and the Department of Housing and Urban Development said on Tuesday 20 October, 5.2% below August's revised 1,288,000 and 7.4% below the rate a year earlier. Building permits, a guide to future activity, held almost steady at 1,400,000.
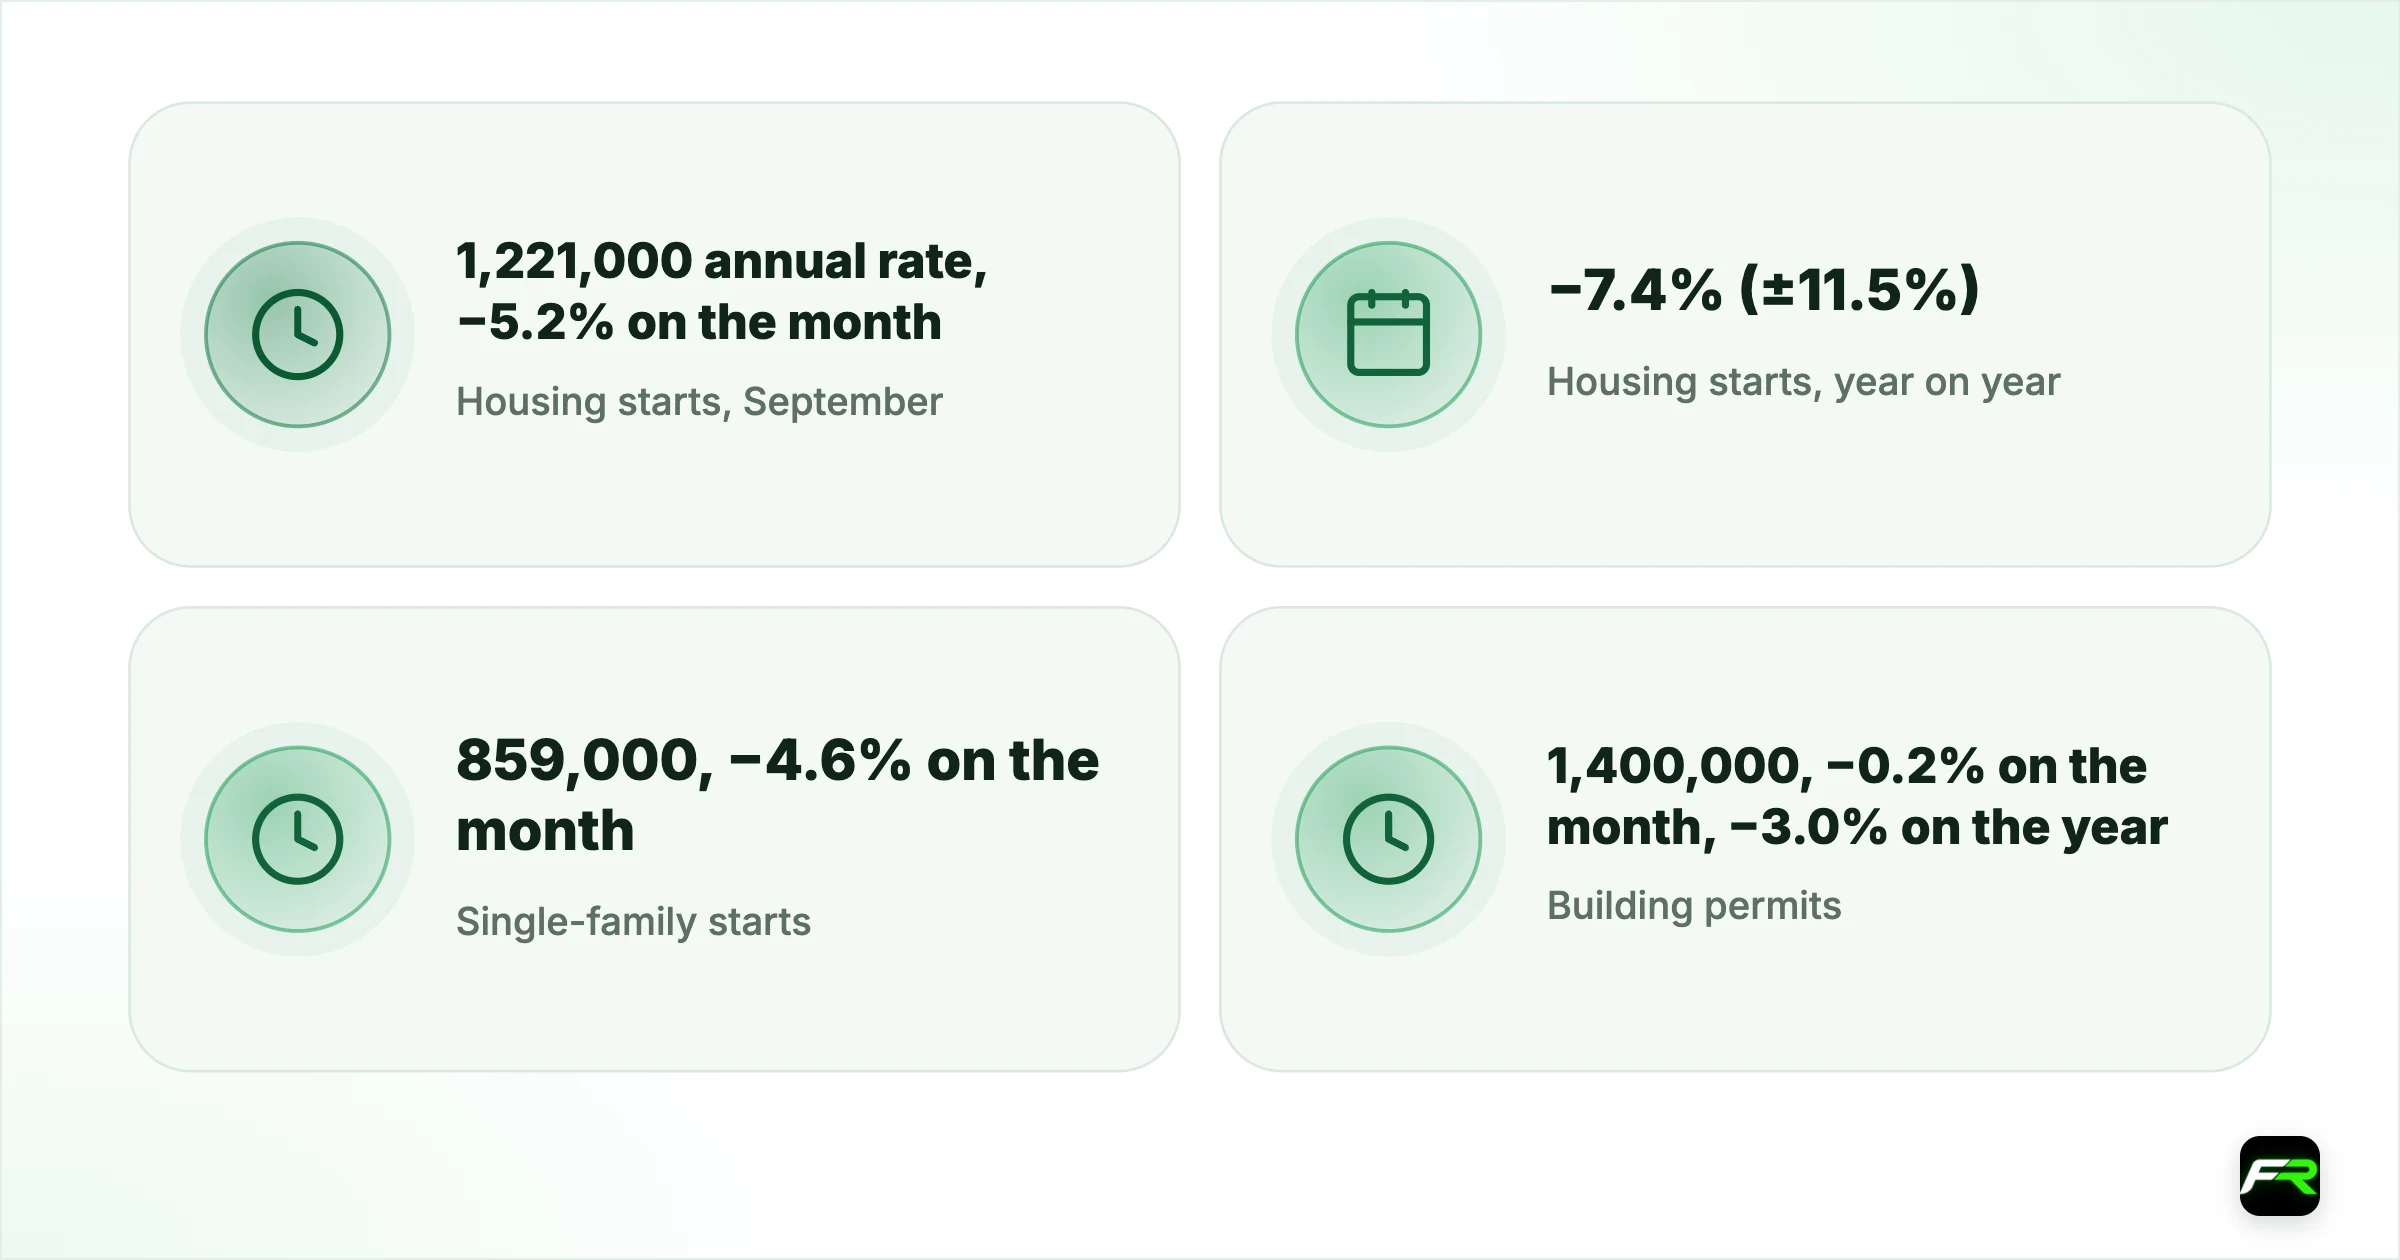
The monthly drop comes with a large margin of error. Census statisticians put a 90% confidence interval of plus or minus 11.8% on the change in starts, which means it cannot say for certain that starts fell at all. Housing figures are noisy from month to month, and traders usually look at the trend across several releases before drawing conclusions.
The dollar slipped through the New York morning. Its index against major currencies eased from about 101.87 before the 12:30 UTC release to a low of 101.51 in the 14:00 hour and was near 101.70 at 18:00 UTC. EUR/USD rose from 1.1216 to 1.1264 over the same stretch. No single release explains a move like that, and housing data rarely drive currencies alone, but a soft report on a quiet day for US news can add to an existing drift.
| Housing starts, September | 1,221,000 annual rate, −5.2% on the month (±11.8%) |
|---|---|
| Housing starts, year on year | −7.4% (±11.5%) |
| Single-family starts | 859,000, −4.6% on the month |
| Building permits | 1,400,000, −0.2% on the month, −3.0% on the year |
| Single-family permits | 845,000, −4.0% on the month |
| Housing completions | 1,192,000, +2.2% on the month, −14.0% on the year |
| 10-year Treasury yield, 19 October | 5.15% (16 October: 5.09%) |
| Fed funds target range | 3.75% to 4.00%, next decision 28 October |
What the Census Bureau reported
Single-family homes, the largest part of the market, saw starts fall 4.6% to an annual rate of 859,000, from a revised 900,000 in August. Starts of buildings with five or more units ran at 349,000. Because the total is an annual rate built from one month's activity, it can swing by tens of thousands of units on weather, the timing of large projects or late survey returns.
Permits give a steadier read. Total authorisations slipped 0.2% to 1,400,000, from a revised 1,403,000, and were 3.0% lower than in September 2025. Single-family permits fell 4.0% to 845,000, while permits for buildings with five or more units reached 503,000. A builder normally needs a permit before breaking ground, so a flat permit count points to activity holding up in the coming months, even if September's starts dipped.
Completions moved the other way. Homes finished in September ran at 1,192,000, up 2.2% on the month but 14.0% lower than a year earlier. That annual fall is large enough to be statistically significant, unlike most of the monthly changes in the report. Fewer completions mean fewer new homes reaching the market, which can keep prices firm even when demand is soft.
| Measure | September 2026 | August 2026 (revised) | Monthly change |
|---|---|---|---|
| Housing starts | 1,221,000 | 1,288,000 | −5.2% |
| Building permits | 1,400,000 | 1,403,000 | −0.2% |
| Housing completions | 1,192,000 | 1,166,000 | +2.2% |
Source: US Census Bureau and US Department of Housing and Urban Development, Monthly New Residential Construction, September 2026. Seasonally adjusted annual rates.
Why builders are cautious
Housing is the part of the US economy that feels interest rates first. The Federal Reserve raised its target range to 3.75% to 4.00% on 16 September, and long-term borrowing costs sit higher still: the US Treasury put the 10-year yield at 5.15% on Monday 19 October and the 30-year at 5.48%. Mortgage rates are priced off those long yields, so a 10-year yield above 5% keeps home loans expensive and weighs on buyers and builders alike.
Costs are rising too. US producer prices rose 6.3% in the year to September, as our PPI story reported, and import prices 8.1%, according to the Bureau of Labor Statistics. Higher prices for fuel, materials and transport make each new project more expensive, at the same moment that buyers are paying more to borrow. A dip in starts is what you would expect from that combination.
For the Fed, weaker housing activity is one of the channels through which tighter policy is meant to cool the economy. A single month will not change its plans for 28 October, when it announces its next decision at 14:00 New York time. Several soft housing reports in a row, alongside cooling jobs figures, would strengthen the case for pausing after September's increase.
What it means for the dollar
Housing starts are a second-tier release for currency markets. They tend to move the dollar only when they surprise by a wide margin or confirm a trend already visible in bigger reports such as jobs and inflation. On Tuesday, the dollar's decline was broad and gradual: it fell against the euro, the pound and the Canadian dollar, while USD/JPY dipped to 157.82 before recovering to about 158.16.
Treasury yields barely moved. The 10-year yield traded between about 5.08% and 5.14% on market data through the day, near Monday's 5.15% official close. When the dollar weakens without a fall in yields, the move often reflects flows and positioning rather than a change in rate expectations, and it can reverse quickly.
The rest of the week is light for US data. On Wednesday the Energy Information Administration publishes its weekly petroleum report, and durable goods orders and new home sales follow on 27 October, the day before the Fed. With oil prices swinging widely, energy may again do more to move the dollar than any housing figure.
What traders can take from it
A housing report rarely sets the tone for a whole week, but it can tell you something about where the economy is heading. Keep these points in mind.
- Check the confidence interval before reacting. A 5.2% drop in starts with a ±11.8% margin is a hint, not a fact.
- Watch permits for direction. They held near 1.4 million, which argues against reading September as the start of a slump.
- Follow the 10-year Treasury yield. A housing slowdown matters for the dollar mainly if it pulls long yields lower.
- Do not chase a slow afternoon drift. The dollar's dip on Tuesday came without a big move in yields and could fade.
- Plan around 28 October. Rate decisions from the Bank of Canada and the Fed fall on the same day, so cut size before then.
Say you buy EUR/USD at 1.1235 after the dollar's dip, with a stop at 1.1205, 30 pips below, and a target at the 1.1280 range top. A standard lot is worth about $10 a pip, so the stop risks about $300 per lot. On a $10,000 account with a 1% limit of $100, the right size is about 33,000 units. The reward is 45 pips against 30 pips of risk, a ratio of 1.5 to 1.
For levels on the main pairs, see our daily EUR/USD analysis and USD/JPY analysis. Upcoming releases are on the economic calendar, and the position size calculator works out the size for any stop.
Currency moves around US data can be fast, and spreads may widen at the release. Leverage magnifies losses as well as gains, so trade only with money you can afford to lose.
Housing figures are from the US Census Bureau and the Department of Housing and Urban Development release of 20 October 2026; percentages in brackets are the bureau's 90% confidence intervals. Treasury yields are the US Treasury's daily par yield curve rates. Producer and import price figures are from the Bureau of Labor Statistics. The Fed's rate and meeting date are from the Federal Reserve. Currency and intraday yield levels are market data built from hourly bars to about 18:00 UTC on 20 October and differ slightly between providers. Comments on the dollar are FX Recap's own reading. This is news, not investment advice.
Frequently asked
How many US housing starts were there in September 2026?
Housing starts ran at a seasonally adjusted annual rate of 1,221,000 in September 2026, 5.2% below August's revised 1,288,000, according to the Census Bureau. The bureau's margin of error on that change was ±11.8%.
Did US building permits fall in September 2026?
Only slightly. Permits were at an annual rate of 1,400,000, 0.2% below August's revised 1,403,000 and 3.0% below September 2025. Single-family permits fell 4.0% to 845,000.
Why do housing starts matter for forex traders?
Housing reacts quickly to interest rates, so a slowdown can signal that Fed policy is cooling the economy. If weak housing pulls Treasury yields lower, the dollar can weaken, though starts alone rarely move currencies much.
When is the next Federal Reserve decision?
The Federal Reserve announces its next decision on 28 October 2026 at 14:00 New York time. Its target range is 3.75% to 4.00% after a rise on 16 September.
Sources: US Census Bureau: Monthly New Residential Construction, September 2026 · US Treasury: daily par yield curve rates, 2026 · Federal Reserve: FOMC meeting calendar · US Census Bureau: 2026 economic indicator calendar
The team behind this guide
Researched, checked and approved by five forex specialists
Every guide is written, fact-checked and edited before it goes live, and updated when the facts change. Spotted an error? Tell us.