IC Markets






































US 5-Year Note Auction: $70 Billion Sells at 4.845%, Down From September's 5.033%, Hours Before the Fed
Foreign-type buyers took 60% of Tuesday's sale and dealers just 10.6%, down from 15.8%, as the euro's reference rate fell to a new 2026 low.
 WriterAbir KhanWriterWrites the guides · checks every figure against primary sources View profileAbout Abir →

 Market analysisTanbir Habib RiyadForex & Crypto AnalystForex and crypto analyst · technical and fundamental analysis View profileAbout Tanbir →

 Fact-checking & riskJannatul FerdaushFact-Checker & Risk AnalystFact-checks every figure · risk analysis · Applied Statistics, University of Dhaka View profileAbout Jannatul →

 Trading reviewJowel RanaCo-Founder & Forex TraderCo-founder · forex trader · reviews guides from a trader's view View profileAbout Jowel →

 Final approvalRanjan NiskrityFounder, Owner & Forex TraderFounder and owner · forex trader · signs off every guide View profileAbout Ranjan →

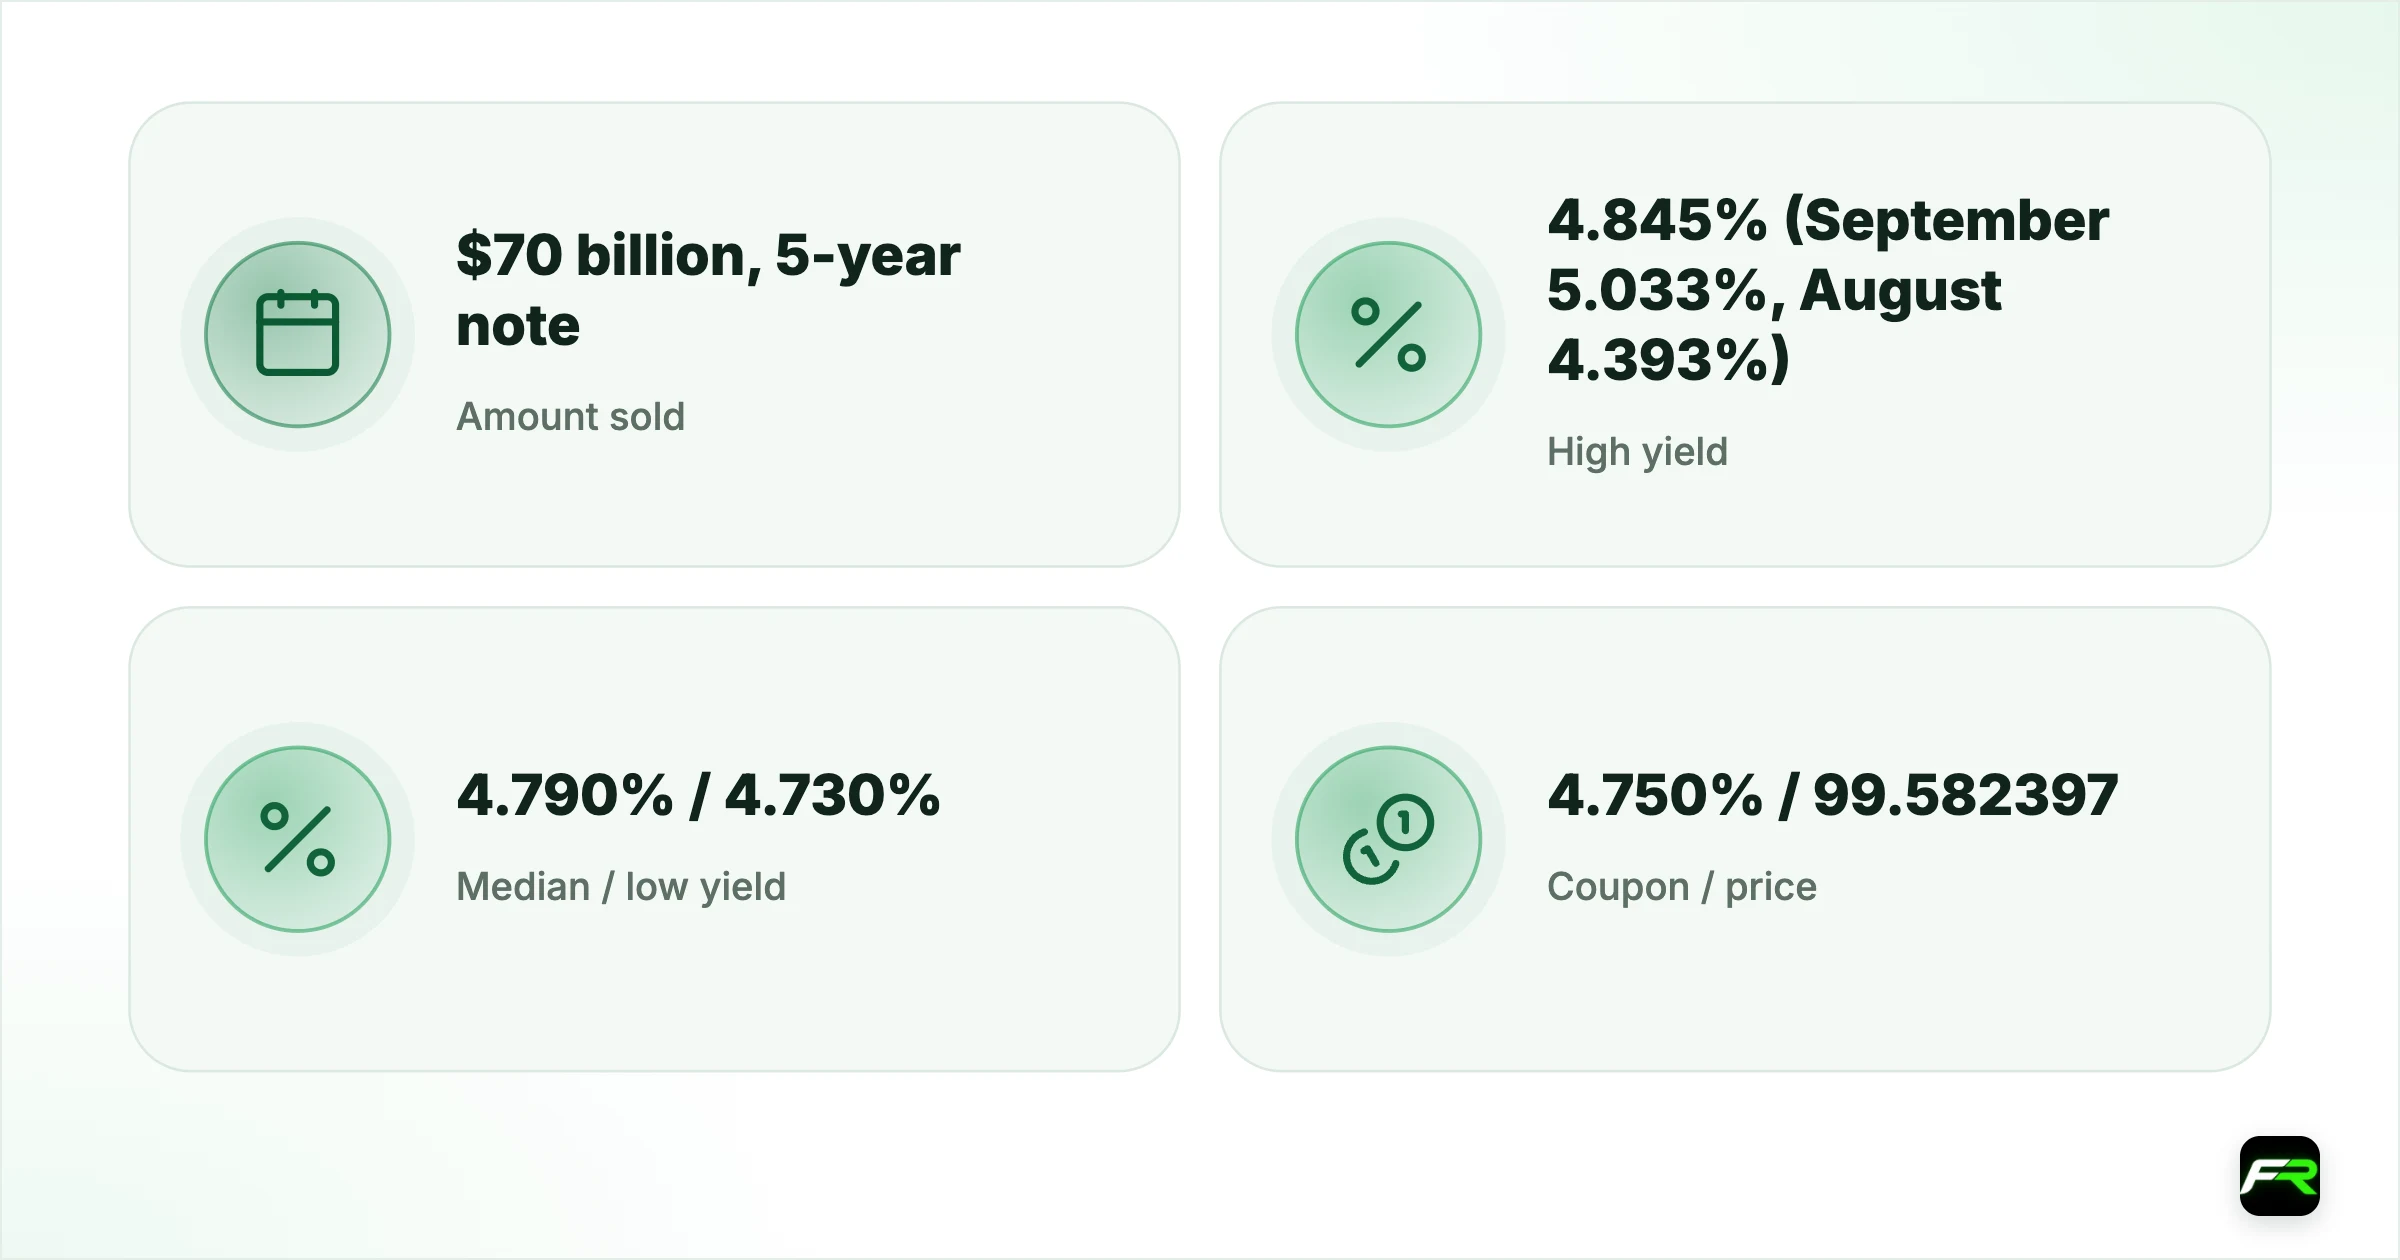
The US Treasury sold $70 billion of new five-year notes on Tuesday 27 October at a high yield of 4.845%, according to its official auction data. That is almost 19 basis points below the 5.033% paid in September, but well above the 3.625% of a year ago, and it came a day before the Federal Reserve announces its next rate decision at 18:00 UTC on Wednesday.
The bidding was the strongest part of the result. Indirect bidders, the group that includes foreign central banks and many overseas investors, took 60.0% of the competitive awards, up from 54.3% in September. Primary dealers, the banks that must bid at every auction and absorb what others leave, ended with only 10.6%, down from 15.8% in September.
| Amount sold | $70 billion, 5-year note (CUSIP 91282CRT0) |
|---|---|
| High yield | 4.845% (September 5.033%, August 4.393%) |
| Median / low yield | 4.790% / 4.730% |
| Coupon / price | 4.750% / 99.582397 |
| Bid-to-cover | 2.33 (September 2.21, August 2.37) |
| Indirect bidders | 60.0% of competitive awards (September 54.3%) |
| Direct bidders | 29.4% (September 29.9%) |
| Primary dealers | 10.6% (September 15.8%) |
What the auction results show
Treasury accepted bids up to 4.845% and set the coupon at 4.750%, so each note sold at 99.582397 per 100 of face value. The median accepted yield was 4.790% and the lowest 4.730%. Bidders at the high yield received 98.60% of the amount they asked for, compared with 30.34% in September, which means far fewer bids were bunched at the top of the range this time.
Total bids were 2.33 times the amount sold, up from 2.21 in September and close to August's 2.37. The Fed's own portfolio, known as SOMA, also rolled $7.78 billion of maturing securities into the new note on top of the public offering. Noncompetitive bidders, who accept whatever yield the auction sets, took about $738 million, including roughly $136 million through retail channels such as TreasuryDirect.
The notes are issued on 2 November and mature on 31 October 2031. Together with Monday's two-year sale, which cleared at 4.708%, this week's auctions show demand holding up even with yields well above the Fed's 3.75% to 4.00% target range.
Who bought the notes
Treasury sorts competitive buyers into three groups. Indirect bidders place orders through a dealer and include foreign official accounts; direct bidders buy for their own account and are often domestic funds; primary dealers are the banks obliged to take part. A high indirect share and a low dealer share usually signal healthy demand from end investors.
On Tuesday indirect bidders were awarded $41.59 billion, direct bidders $20.36 billion and dealers $7.31 billion of the $69.26 billion sold competitively. Those are shares of 60.0%, 29.4% and 10.6%. In September they were 54.3%, 29.9% and 15.8%, so the extra demand came almost entirely from the indirect group, and dealers had to take about a third less of the sale.
The contrast with Monday's two-year auction is worth noting. There, the indirect share fell to 45.7% and direct bidders stepped in. One explanation could be that different investors favour different maturities, but Treasury's data show who bought, not why, so treat any reading of motives with care.
How the five-year fits the yield curve
The Treasury's daily par yield curve put the five-year yield at 4.82% at Tuesday's close, down from 4.84% on Monday, 4.95% on 21 October and 5.00% on 14 October. The two-year closed at 4.70% and the ten-year at 4.99%, so the curve between two and ten years is about 29 basis points steep.
Five-year yields matter because they cover the period over which markets price the Fed's path beyond the next few meetings. A five-year yield around 4.8%, with the Fed's range topping out at 4.00%, suggests investors expect policy to stay tight for some time, or demand extra compensation for inflation risk. The fall since mid-October shows some of that premium coming out ahead of the Fed.
The longer run shows how far yields have climbed. A year ago, on 27 October 2025, the five-year note sold at 3.625%, and the lowest result in the past 14 monthly auctions was 3.562% in November 2025. Yields then rose through 2026 to 4.393% in August and 5.033% in September, the highest of that run, before Tuesday's step back to 4.845%. Every one of those sales was for $70 billion, so the changes reflect price, not size.
That path matters for anyone holding dollar positions over weeks rather than hours. Higher five-year yields make it more expensive for US households and firms to borrow, which can slow the economy, but they also make dollar assets more attractive to foreign savers. Which effect wins depends largely on what the Fed signals next.
Treasury's results do not include the yield at which the note traded just before the 13:00 New York bidding deadline, so the size of any tail, the gap between that level and the high yield, cannot be measured from official data. We therefore do not state one, and you should be wary of social media posts that quote a tail without naming a source.
Why it matters for currencies
Strong foreign demand for US debt supports the dollar indirectly, because overseas buyers must convert their currency into dollars to pay. Yield gaps also drive currencies. The euro's slide to a new 2026 low fits that picture: EUR/USD's ECB reference rate fell to 1.1150 on Tuesday, below the 1.1177 low of 7 October, while USD/JPY, derived from the same rates, rose for a second day to 157.82.
Lower US yields since mid-October have not weakened the dollar much, which suggests other forces are at work, including energy prices and weaker growth in Europe. Our story on last week's drop in yields covers the earlier move.
Today's Fed decision is the bigger test. A firm message that more hikes are possible would likely lift short and medium yields again, while a cautious tone could extend the fall in the five-year. Our Fed preview sets out the options.
The rest of this week's supply
| Auction | Date | Size and result |
|---|---|---|
| 2-year note | Mon 26 October | $69 billion at 4.708% |
| 5-year note | Tue 27 October | $70 billion at 4.845% |
| 2-year floating rate note | Wed 28 October | $30 billion |
| 7-year note | Thu 29 October | $44 billion |
Wednesday's floating rate note pays interest that resets with the 13-week bill rate, so its result says little about the Fed's path. Thursday's seven-year note closes on the same day as the ECB decision and US third-quarter GDP, which could make it the busiest day of the week for yields.
What it means for traders
- Keep auctions in proportion. A strong result can move yields a few basis points; a Fed surprise at 18:00 UTC today can move them far more.
- Watch the dealer share at Thursday's seven-year sale. A jump well above 15% would suggest demand is fading.
- Use the Treasury's own daily yield curve for levels rather than screenshots.
- EUR/USD is at a 2026 low and stretched, so sharp rebounds are possible around the Fed and the ECB.
- Check the timing of every release on our economic calendar.
Suppose you hold a USD/JPY long at 157.80 with a stop at 157.30, 50 pips away, into the Fed. On a $6,000 account with a 1% risk limit you can lose $60. Each pip on 10,000 units is worth about $0.63 at this rate, so about 19,000 units keeps the risk near $60. A Fed surprise can gap the price past the stop, so many traders halve the size into the decision. The <a href="/position-size-calculator">position size calculator</a> handles the conversion.
See today's levels in our EUR/USD analysis and USD/JPY analysis, and Monday's two-year auction story.
Bond auctions and central bank decisions can move currencies quickly, and prices can gap past stop orders. Leverage magnifies losses as well as gains, so trade only with money you can afford to lose.
Auction results and the week's schedule come from the US Treasury's TreasuryDirect auction data. Closing yields are from the Treasury's daily par yield curve. Exchange rates are ECB euro reference rates or derived from them. The bidder shares are FX Recap's calculation from the Treasury's awarded amounts. This is news, not investment advice.
Frequently asked
What was the yield at the US 5-year note auction on 27 October 2026?
The US Treasury sold $70 billion of five-year notes at a high yield of 4.845%, with a 4.750% coupon and a bid-to-cover ratio of 2.33, according to TreasuryDirect.
Was the 5-year auction strong or weak?
Demand was strong. Indirect bidders took 60.0% of competitive awards, up from 54.3% in September, and primary dealers only 10.6%. The bid-to-cover ratio rose to 2.33 from 2.21.
Why does the 5-year Treasury yield matter for forex?
It reflects where investors expect US interest rates to be over the next few years. Gaps between US and foreign yields drive pairs such as EUR/USD and USD/JPY, and strong foreign demand for Treasuries can support the dollar.
What other Treasury auctions are due this week?
TreasuryDirect lists a $30 billion two-year floating rate note on 28 October and a $44 billion seven-year note on 29 October, after the two-year and five-year notes on 26 and 27 October.
Sources: TreasuryDirect: Auctioned securities data (5-year note, 27 October 2026) · US Treasury: Daily Treasury par yield curve rates · TreasuryDirect: Upcoming auctions · European Central Bank: euro foreign exchange reference rates · Federal Reserve: FOMC meeting calendar
The team behind this guide
Researched, checked and approved by five forex specialists
Every guide is written, fact-checked and edited before it goes live, and updated when the facts change. Spotted an error? Tell us.