IC Markets

 3:09
 2:39
 2:10
 2:18
 3:43
 8:42




































US Productivity Jumps 3.6% in Q3 as Unit Labor Costs Fall and the Labor Share Hits a Record Low
Output per hour rose at a 3.6% annual pace while unit labour costs fell 0.7%. Why that eases wage-inflation fears and what it means for yields.
 WriterAbir KhanWriterWrites the guides · checks every figure against primary sources View profileAbout Abir →

 Market analysisTanbir Habib RiyadForex & Crypto AnalystForex and crypto analyst · technical and fundamental analysis View profileAbout Tanbir →

 Fact-checking & riskJannatul FerdaushFact-Checker & Risk AnalystFact-checks every figure · risk analysis · Applied Statistics, University of Dhaka View profileAbout Jannatul →

 Trading reviewJowel RanaForex TraderForex trader · reviews guides from a trader's view View profileAbout Jowel →

 Final approvalRanjan N. MondolForex TraderForex trader · signs off every guide View profileAbout Ranjan →

American workers produced a lot more per hour in the third quarter. Nonfarm business productivity rose at a 3.6% annualised rate, the Bureau of Labor Statistics said on Thursday 5 November, as output grew 3.7% while hours worked rose only 0.1%. Compared with a year earlier, productivity was up 2.1%.
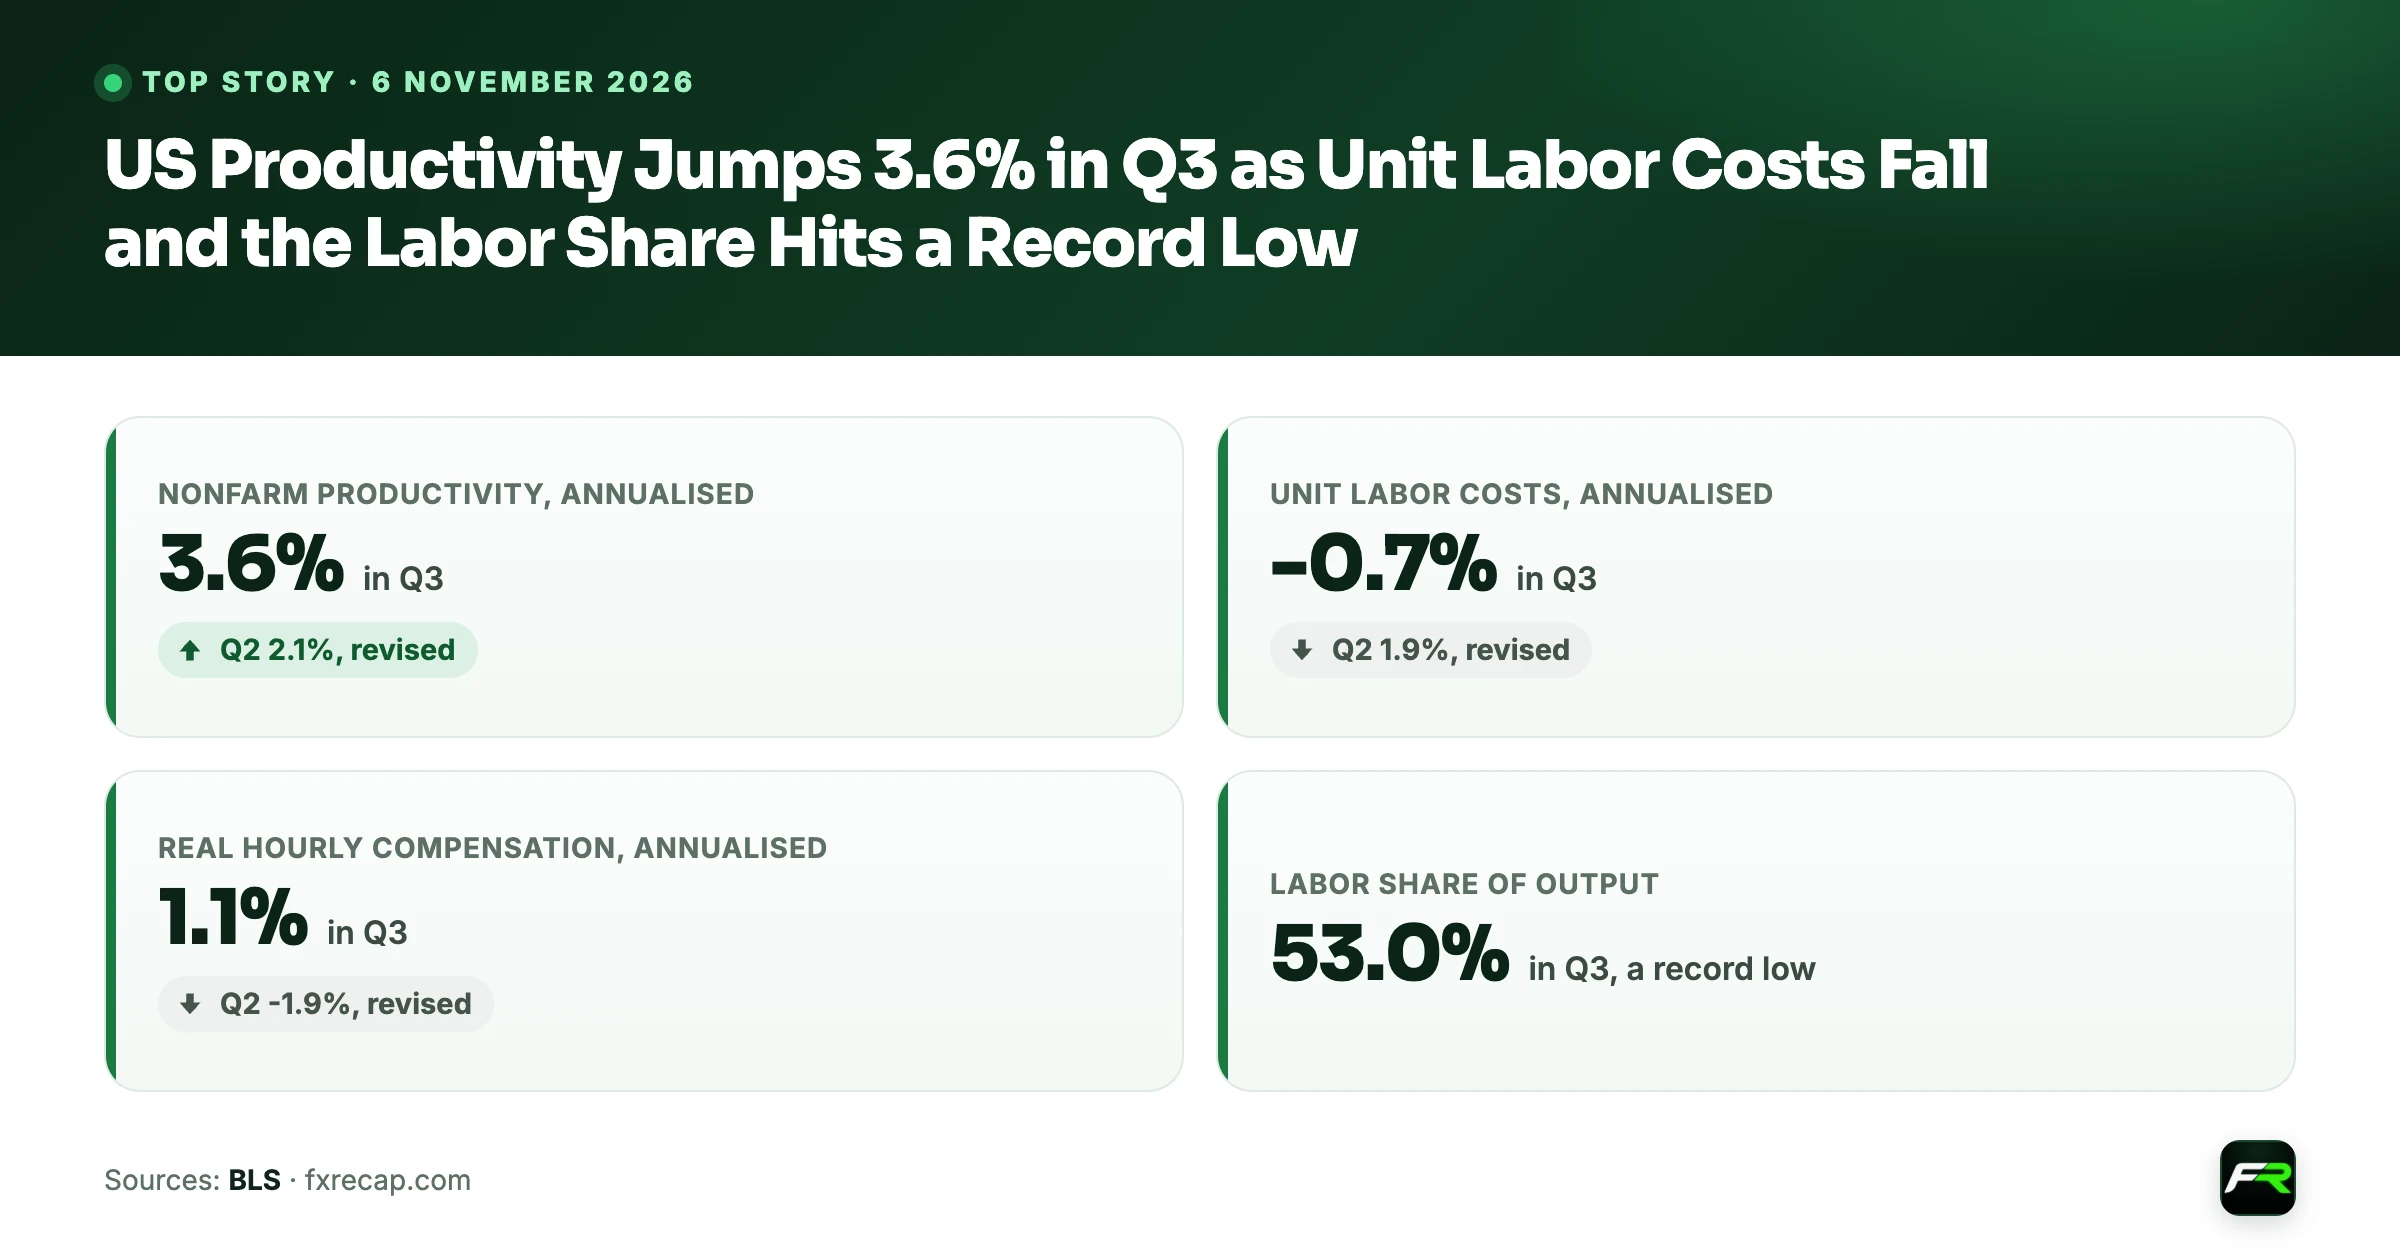
The cost side is the part that matters most for inflation. Unit labour costs, which measure how much firms pay in wages and benefits for each unit of output, fell at a 0.7% rate. Hourly compensation rose 2.9%, but productivity grew faster, so the labour cost of making each item went down. Over four quarters, unit labour costs were up 2.4%.
One more figure stood out. The labour share, the part of business output paid to workers as compensation, fell to 53.0%, the lowest reading in a series that starts in 1947. Growth is going to profits and investment far more than to pay.
| Nonfarm productivity, annualised (BLS) | 3.6% in Q3 (Q2 2.1%, revised) |
|---|---|
| Unit labor costs, annualised (BLS) | -0.7% in Q3 (Q2 1.9%, revised) |
| Real hourly compensation, annualised (BLS) | 1.1% in Q3 (Q2 -1.9%, revised) |
| Labor share of output (BLS) | 53.0% in Q3, a record low |
What the BLS reported
These are preliminary figures and include the annual revision of the national accounts that the Bureau of Economic Analysis published on 30 September. Second-quarter productivity was revised up by 0.7 points to 2.1%, and second-quarter unit labour costs were revised up by the same amount to 1.9%. So the picture before this release was already one of solid efficiency gains.
Viewed over a longer stretch, the numbers are strong without being unusual. Since the fourth quarter of 2019, productivity has grown at 2.2% a year. That beats the 1.5% pace of the 2007 to 2019 cycle and matches the long-run average since 1947. The third quarter was simply a good one inside a decent trend.
Manufacturing told a different story. Factory productivity rose only 0.3% and unit labour costs in the sector climbed 2.7% in the quarter and 4.0% over the year. Durable goods makers did better than non-durable ones, where productivity fell 1.7%.
Why falling labour costs matter for inflation
The Fed's worry, like the Bank of England's, is that higher energy prices spread into wages and then into the prices of everything else. Unit labour costs are one of the best guides to whether that is happening. When they fall, firms face less pressure to raise prices to protect margins, even if wages are rising.
Thursday's data argues that US wage pressure is contained for now. Hourly compensation of 2.9% is moderate, and adjusted for consumer prices it rose 1.1%. Workers' real pay recovered after a 1.9% drop in the second quarter, but most of the gain from higher output went elsewhere, as the record-low labour share shows.
The Fed had already noticed the trend. Its 28 October statement said “productivity growth is strong, and capital investment is robust.” Fast productivity growth lets an economy grow quickly without overheating, which is one reason some officials preferred to wait in October instead of raising rates again. The release gives that group more evidence, although inflation “remains elevated,” in the Fed's own words.
What a record-low labour share tells you
A labour share of 53.0% means that, of every dollar of output the nonfarm business sector produced, about 53 cents went to workers as wages, salaries and benefits. The rest went to profits, interest, depreciation and other costs. No quarter since 1947 has shown a smaller slice for workers.
For markets this cuts two ways. Strong margins support company earnings and business investment, which helps explain why output is growing so fast. A low and falling labour share also leaves room for wage catch-up later, especially if workers start bargaining harder after a year of energy-driven price rises. Central banks watch that risk closely; the Bank of England raised its own rate on Thursday partly because it fears exactly this kind of second-round effect in Britain.
Investment is the link to watch. Fed Chair Kevin Warsh said in October that high-tech investment is leading US growth, and the Bank of England's minutes credit some of Britain's stronger activity to the deployment of artificial intelligence. If that spending keeps lifting output per hour, the US can grow quickly with less inflation. If it fades, the cost advantage shown in this release could shrink just as quickly.
How bonds and the dollar responded
Treasury yields fell on the day the data came out. According to the Treasury's daily par yield curve, the 2-year yield dropped to 4.46% from 4.58% and the 10-year to 4.84% from 4.90%. A week earlier, on 28 October, the 10-year had been at 5.05%. Several things moved markets on Thursday, including the Bank of England's rate rise, so the fall cannot be pinned on productivity alone.
On the reference rates, the yen did not gain from lower US yields: USD/JPY, derived from ECB reference rates, was 158.46 on Thursday against 158.25 on Wednesday. That fixing is set at about 13:15 UTC, before the 13:30 UTC release, so it does not capture any reaction to the data itself. The pair remains close to the top of its recent range.
USD/JPY levels to watch
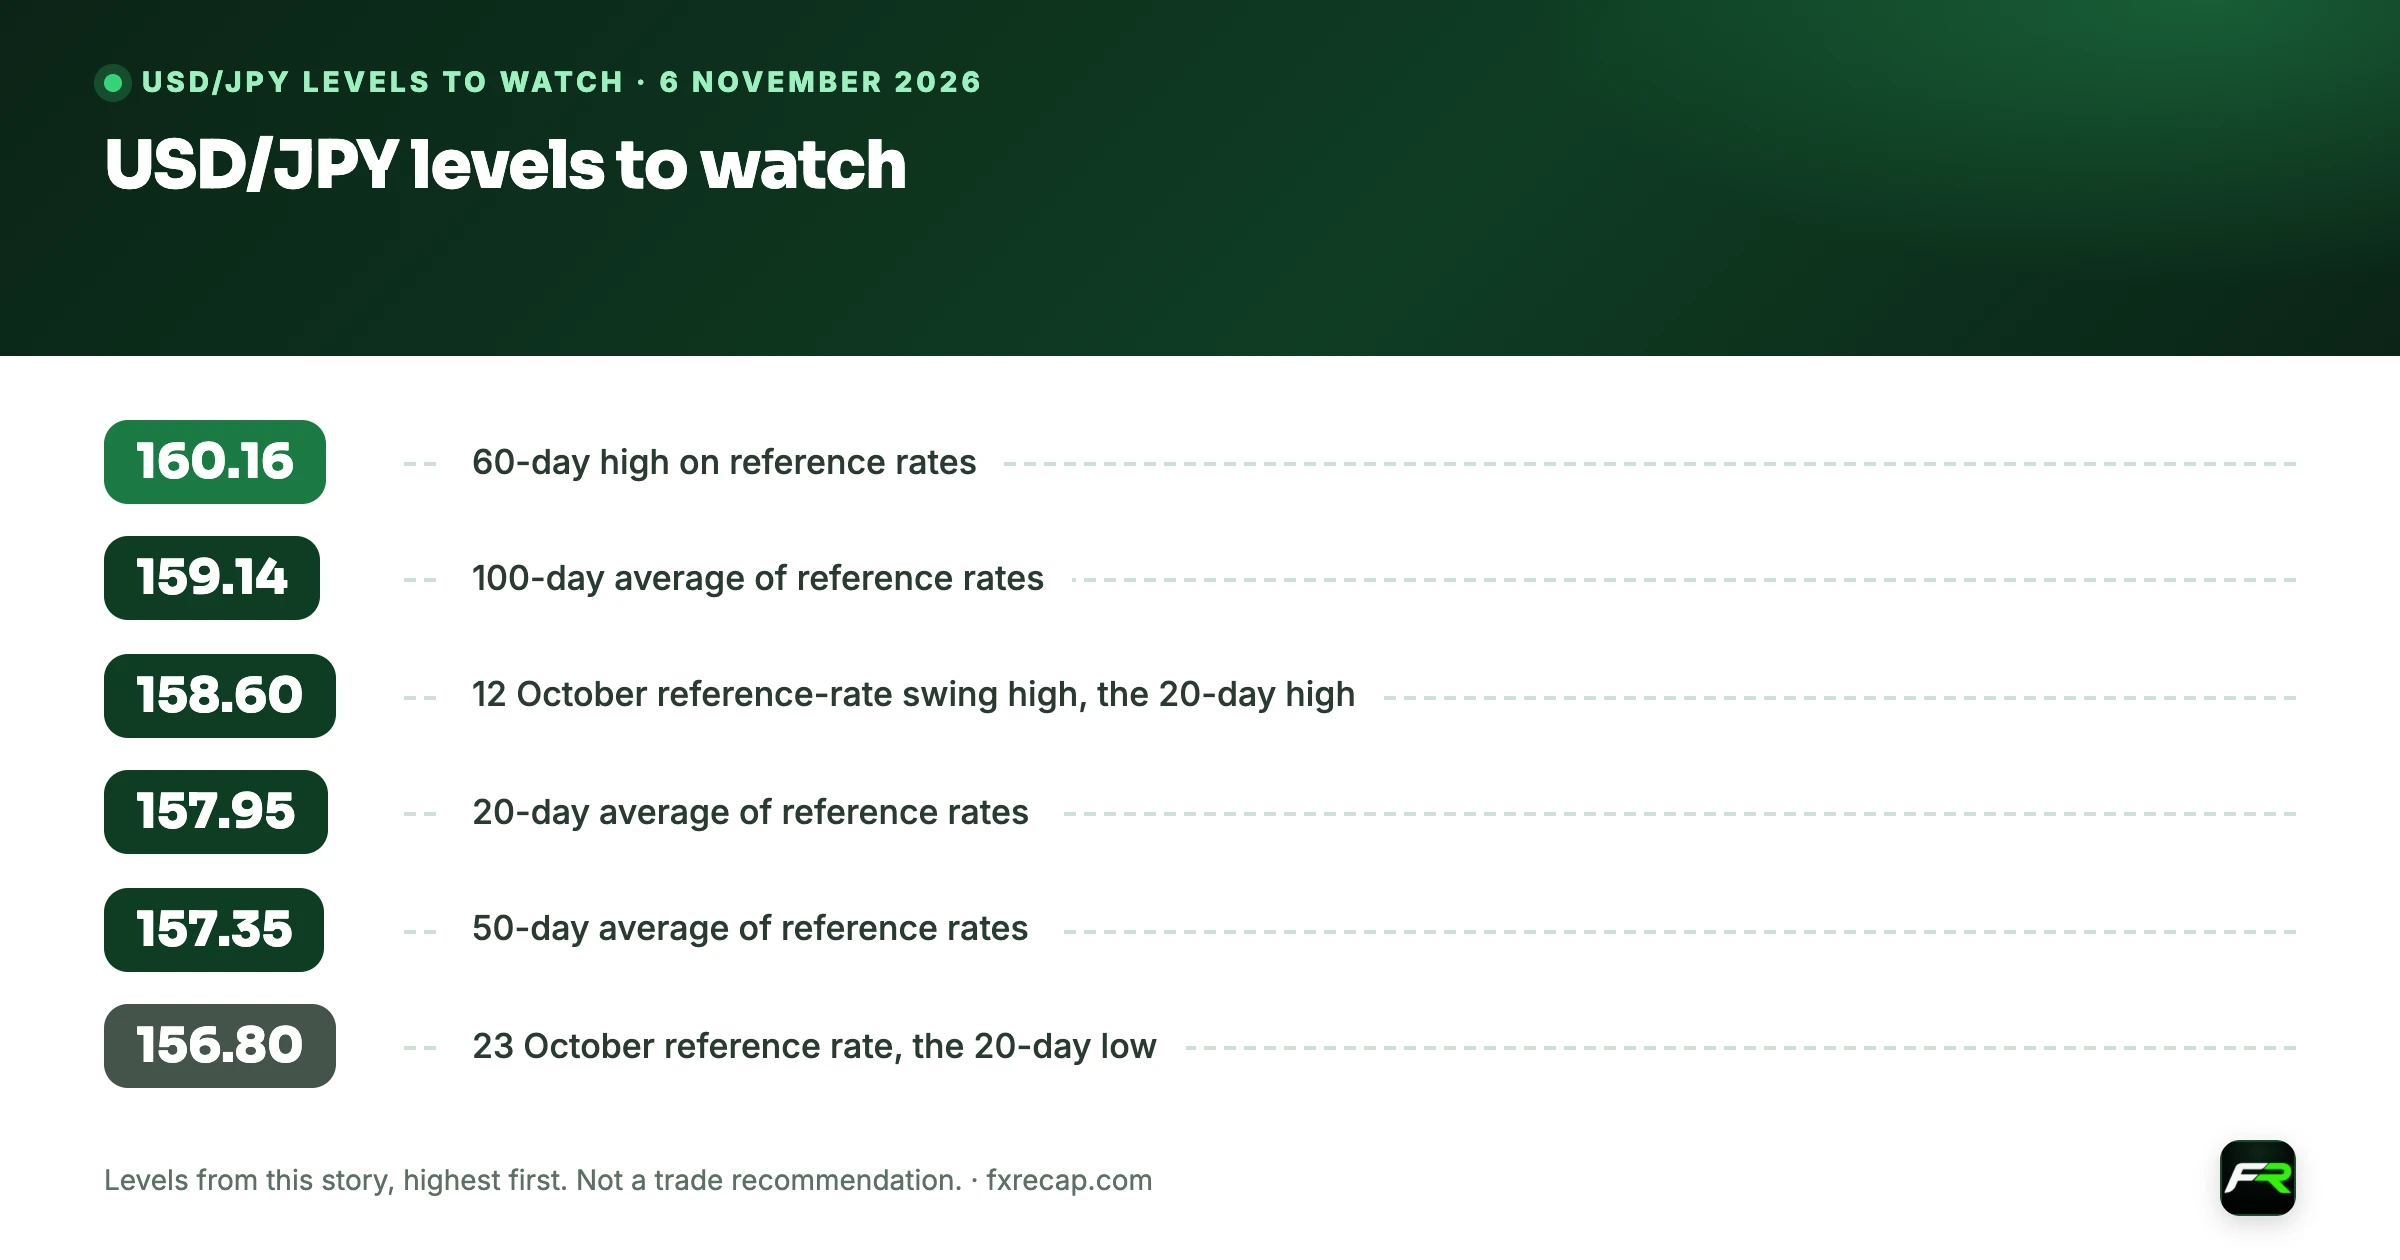
These levels come from ECB reference rates converted to USD/JPY by dividing EUR/JPY by EUR/USD. They are daily fixings, not intraday highs or lows.
| Level | Why it matters |
|---|---|
| 160.16 | 60-day high on reference rates |
| 159.14 | 100-day average of reference rates |
| 158.60 | 12 October reference-rate swing high, the 20-day high |
| 157.95 | 20-day average of reference rates |
| 157.35 | 50-day average of reference rates |
| 156.80 | 23 October reference rate, the 20-day low |
USD/JPY is pressing the 158.60 high of the past month. It stands above its 20 and 50-day averages but below the 100-day average at 159.14, with a 14-day RSI of about 56. If lower US yields persist after today's jobs report, the 20-day average near 157.95 is the first support on these fixings. A strong report that lifts yields again would bring 158.60 and then the 100-day average into play.
What it means for traders
A productivity boom is good news for growth and mildly good news for inflation, which is an awkward mix for currency traders. It can support the dollar through strong growth and investment while also cooling the case for higher rates. Today's jobs report will show which side the market leans towards.
- Treat these figures as a first estimate. The BLS revises productivity when GDP and hours data change, and the second-quarter revision this time was 0.7 points.
- Pair unit labour costs with average hourly earnings in the jobs report. Soft pay plus falling labour costs would add to the case for the Fed to wait in December.
- Keep an eye on the 2-year yield. USD/JPY and gold both respond to it, and Thursday's 12 basis point fall was large.
- See the live price on our USD/JPY analysis and the full release list on the economic calendar.
Suppose you want to buy USD/JPY at 158.40 with a stop at 157.80, 60 pips below, under the 20-day average. On a $4,000 account risking 1%, the most you can lose is $40. At 158.40 one pip on 10,000 units is worth about $0.63, so a 60-pip stop allows roughly 10,500 units. If the jobs data gaps the price 25 pips past the stop, the loss grows to about $57. Our <a href="/position-size-calculator">position size calculator</a> handles the yen conversion.
US data releases can move currencies and bond yields sharply, and prices can gap past stop orders. Leverage magnifies losses as well as gains, so only trade money you can afford to lose. This article is news and education, not a recommendation to buy or sell.
Productivity, unit labour costs, compensation and the labour share are from the US Bureau of Labor Statistics' preliminary Productivity and Costs release for the third quarter of 2026, published on 5 November. Fed wording is from the 28 October FOMC statement. Yields are Treasury par yields; USD/JPY is derived from ECB euro reference rates.
Cite this guide
FX Recap, "US Productivity Jumps 3.6% in Q3 as Unit Labor Costs Fall and the Labor Share Hits a Record Low", updated 6 November 2026, https://fxrecap.com/forex-news/top-stories/us-productivity-3-6-percent-q3-2026
Free to quote with a link. Journalists: data and comment in our press room.
Frequently asked
How much did US productivity grow in the third quarter of 2026?
Nonfarm business productivity rose at a 3.6% annualised rate in the third quarter, according to the BLS preliminary estimate of 5 November, and was 2.1% higher than a year earlier.
What are unit labor costs and why did they fall?
Unit labour costs are the compensation firms pay per unit of output. They fell at a 0.7% annualised rate because hourly compensation rose 2.9% while productivity rose faster, by 3.6%.
What is the US labor share?
It is the share of nonfarm business output paid to workers as compensation. It fell to 53.0% in the third quarter of 2026, the lowest level in a series that begins in 1947.
How did Treasury yields move after the productivity data?
On 5 November the 2-year Treasury par yield fell to 4.46% from 4.58% and the 10-year to 4.84% from 4.90%, though other news, including the Bank of England's rate rise, also moved markets that day.
Sources: US Bureau of Labor Statistics: Productivity and Costs, Third Quarter 2026, preliminary · US Treasury: daily par yield curve rates · Federal Reserve: FOMC statement, 28 October 2026 · ECB: euro foreign exchange reference rates
The team behind this guide
Researched, checked and approved by five forex specialists
Every guide is written, fact-checked and edited before it goes live, and updated when the facts change. Spotted an error? Tell us.