IC Markets




































Gold Rebounds Toward $4,200 as Long-Dated Treasury Yields Ease
Gold futures gained $83 in two sessions to close Friday at $4,216 as the 30-year Treasury yield slipped from its 2026 high. Spot gold held near $4,196 on Monday ahead of US inflation data.
 WriterAbir KhanWriterWrites the guides · checks every figure against primary sources View profileAbout Abir →
 Market analysisTanbir Habib RiyadForex & Crypto AnalystForex and crypto analyst · technical and fundamental analysis View profileAbout Tanbir →
 Fact-checking & riskJannatul FerdaushFact-Checker & Risk AnalystFact-checks every figure · risk analysis · Applied Statistics, University of Dhaka View profileAbout Jannatul →
 Trading reviewJowel RanaCo-Founder & Forex TraderCo-founder · forex trader · reviews guides from a trader's view View profileAbout Jowel →
 Final approvalRanjan NiskrityFounder, Owner & Forex TraderFounder and owner · forex trader · signs off every guide View profileAbout Ranjan →
Gold has bounced back from its two-month low. COMEX gold futures rose $47.10 on Friday 9 October to close at $4,216.30 an ounce, after a $36 gain on Thursday, taking the metal $125 above Wednesday's low of $4,091. Spot gold traded near $4,196 early on Monday, holding most of the rally.
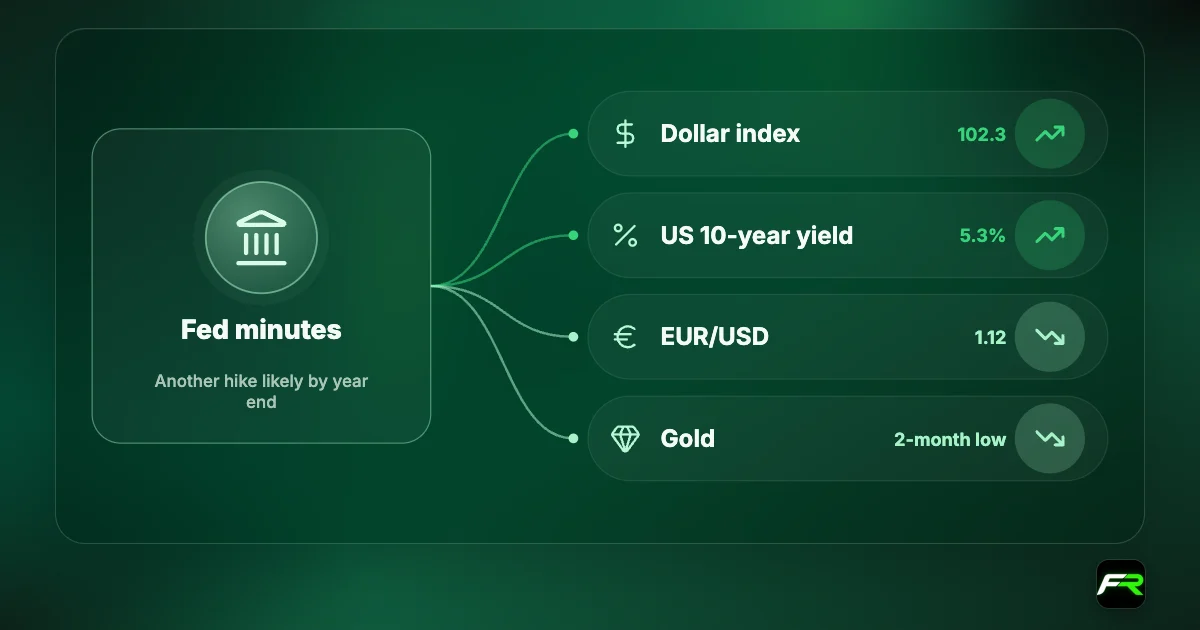
The trigger was the bond market. Long-dated US Treasury yields, which had been climbing for weeks, pulled back from their highest levels of the year. Gold pays no interest, so when yields fall, the cost of holding it falls too, and buyers tend to return.
| Gold futures, close 9 October | $4,216.30, up $47.10 on the day |
|---|---|
| Two-session gain (8-9 October) | About $83 |
| Wednesday's futures low | $4,091.20, lowest since early August |
| Spot gold, 12 October, 05:00 UTC | About $4,196 |
| 30-year Treasury yield | 5.60% on 9 October, from 5.67% on 7 October |
| 30-year auction, 8 October | $22 billion at 5.618%, bid-to-cover 2.54 |
What happened in the bond market
The 30-year Treasury yield closed at 5.67% on Wednesday 7 October, its highest close of 2026, according to the US Treasury's daily yield curve data. On Thursday it fell to 5.60% and stayed there on Friday. The 10-year yield followed a similar path, slipping from 5.28% to 5.22% on Thursday before ending the week at 5.24%.
Thursday's move came on the day of a $22 billion auction of 30-year bonds. According to TreasuryDirect, the sale cleared at a high yield of 5.618% with a bid-to-cover ratio of 2.54, and indirect bidders, a group that includes foreign central banks, took about 72% of the bonds sold to competitive bidders. Market reports described demand as strong. The yield was still the highest at a 30-year auction this year, as the table shows.
| 30-year auction | High yield | Bid-to-cover | Indirect bidders' share |
|---|---|---|---|
| 9 July 2026 | 5.058% | 2.44 | 78% |
| 13 August 2026 | 5.216% | 2.39 | 67% |
| 10 September 2026 | 5.308% | 2.61 | 79% |
| 8 October 2026 | 5.618% | 2.54 | 72% |
Source: TreasuryDirect auction results. Indirect bidders' share is of competitive bids accepted.
How gold tracked yields last week
Day by day, gold moved opposite to the 30-year yield. When the yield jumped to its 2026 high on Wednesday, gold futures fell $61. When it dropped on Thursday, gold rose $36, and Friday's gain extended the rebound.
| Day | Gold futures close | Change | 30-year yield |
|---|---|---|---|
| Mon 5 Oct | $4,161.4 | −$0.9 | 5.66% |
| Tue 6 Oct | $4,193.6 | +$32.2 | 5.64% |
| Wed 7 Oct | $4,133.0 | −$60.6 | 5.67% |
| Thu 8 Oct | $4,169.2 | +$36.2 | 5.60% |
| Fri 9 Oct | $4,216.3 | +$47.1 | 5.60% |
Gold futures: UTC daily candles built from hourly market data. Yields: US Treasury daily par yield curve. Futures traded about $25 above spot gold on Monday morning.
Is the downtrend over?
Not yet. Spot gold peaked near $4,460 in early September and has made lower highs since. It still trades below its 20-day average, around $4,240 in spot terms, as well as its 50-day and 100-day averages. A daily close above the $4,240 area would be the first sign that the September downtrend has ended; a drop back below $4,140 would point to another test of last week's low.
Our gold analysis today has the full set of levels and three trade plans for the session.
What could move gold this week
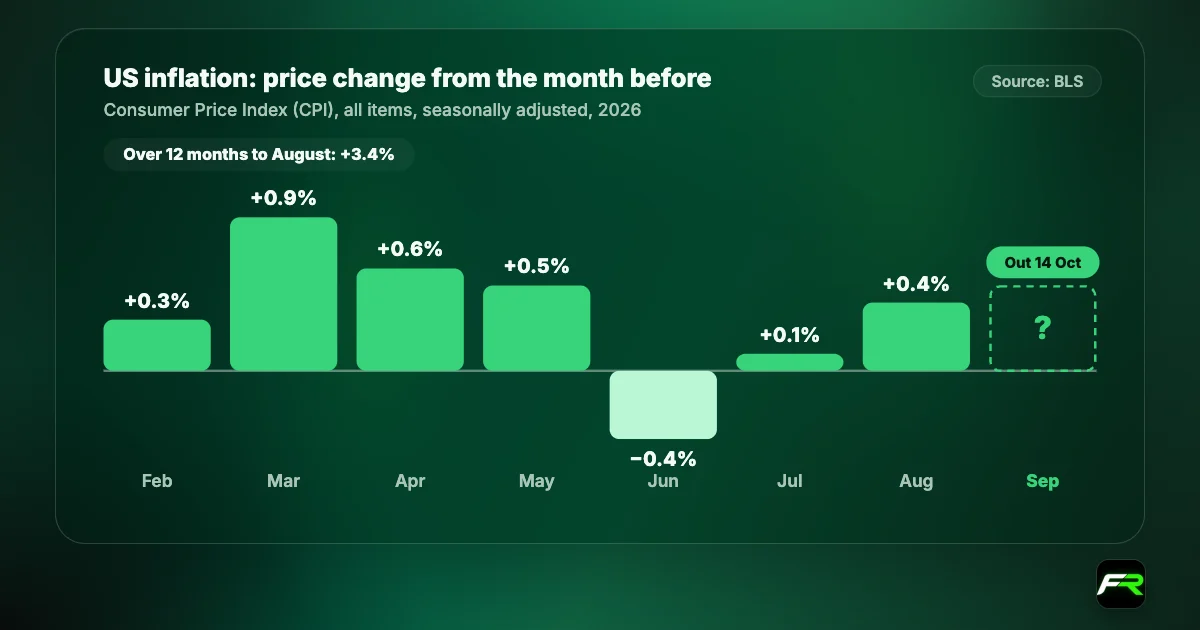
US consumer prices for September are due on Wednesday 14 October at 12:30 UTC, followed by producer prices on Thursday. August inflation was 3.4% over the year, according to the Bureau of Labor Statistics. A hot reading would likely push yields back up and weigh on gold; a soft one would support the rebound.
The Middle East is the other wild card. Reuters reported weekend attacks on two tankers and more Houthi strikes on Saudi energy assets, with Brent crude near $103 a barrel. Higher oil feeds inflation fears, which can lift yields and hurt gold, but a sharp escalation can also spark safe-haven buying. That two-way risk is why gold's daily swings are so wide.
- Size gold trades with the gold lot size calculator; a $40 move on one standard lot is $4,000.
- Watch the 30-year Treasury yield; last week it led gold almost every day.
- Avoid opening new trades in the minutes around Wednesday's CPI release.
- Check whether your broker quotes spot gold or a futures-based price before comparing levels.
A trader in Mumbai buys 0.10 lots of XAU/USD (10 ounces) at $4,190 with a stop at $4,160. Each $1 move is worth $10, so the stop risks $300, or about ₹28,700 at 95.8 rupees per dollar. If gold reaches the $4,240 resistance, the gain is $500. Keeping the size small lets the trade survive a $20 swing around the CPI release.
Gold CFDs are leveraged, and price gaps around data releases can push losses past a stop. Trade only with money you can afford to lose.
Auction results are from TreasuryDirect, and yields are from the US Treasury's daily par yield curve. Inflation data is from the Bureau of Labor Statistics. Gold prices are market data (COMEX futures and spot) and differ slightly between providers. The description of auction demand, the Gulf attacks and Brent prices are as reported. This is news, not investment advice.
Frequently asked
Why did gold rise on 9 October 2026?
Long-dated US Treasury yields pulled back from their 2026 highs after Thursday's 30-year bond auction. Lower yields reduce the cost of holding gold, which pays no interest. Futures rose $47.10 to $4,216.30.
What was the yield at the October 2026 30-year Treasury auction?
The $22 billion reopening on 8 October cleared at 5.618%, with a bid-to-cover ratio of 2.54, according to TreasuryDirect. That was the highest yield at a 30-year auction this year.
What is the gold price today?
Spot gold traded near $4,196 an ounce at 05:00 UTC on 12 October 2026, with COMEX futures about $25 higher near $4,220. Prices differ slightly between providers.
Why do higher Treasury yields hurt gold?
Gold pays no interest. When bonds pay more, holding gold costs more in lost income, so some investors switch to bonds. Higher yields also tend to strengthen the dollar, which makes gold more expensive for buyers outside the US.
What could move gold this week?
US consumer price data on Wednesday 14 October and producer prices on Thursday, Treasury yields, and news from the Middle East, where attacks on Gulf energy assets have kept oil above $100 a barrel.
Sources: TreasuryDirect: auction results · US Treasury: daily par yield curve rates · US Bureau of Labor Statistics: Consumer Price Index · Advisor Perspectives (Bloomberg): Gold advances as auction demand lowers yields, 9 Oct
The team behind this guide
Researched, checked and approved by five forex specialists
Every guide is written, fact-checked and edited before it goes live, and updated when the facts change. Spotted an error? Tell us.