IC Markets






































Australian CPI Rises to 4.3% in September as Fuel Lifts Transport 8.7%; RBA Meets Next Week
Headline inflation climbed from 4.0% and the quarterly trimmed mean hit 3.7%, keeping a fifth RBA rate rise in play for 3 November.
 WriterAbir KhanWriterWrites the guides · checks every figure against primary sources View profileAbout Abir →

 Market analysisTanbir Habib RiyadForex & Crypto AnalystForex and crypto analyst · technical and fundamental analysis View profileAbout Tanbir →

 Fact-checking & riskJannatul FerdaushFact-Checker & Risk AnalystFact-checks every figure · risk analysis · Applied Statistics, University of Dhaka View profileAbout Jannatul →

 Trading reviewJowel RanaCo-Founder & Forex TraderCo-founder · forex trader · reviews guides from a trader's view View profileAbout Jowel →

 Final approvalRanjan NiskrityFounder, Owner & Forex TraderFounder and owner · forex trader · signs off every guide View profileAbout Ranjan →

Australian consumer prices rose 4.3% in the 12 months to September, up from 4.0% in August, the Australian Bureau of Statistics reported on Wednesday 28 October. Prices rose 0.8% in the month in original terms and 0.6% after seasonal adjustment. Transport did most of the damage again: the group jumped 3.0% in September alone and is now 8.7% higher than a year ago.
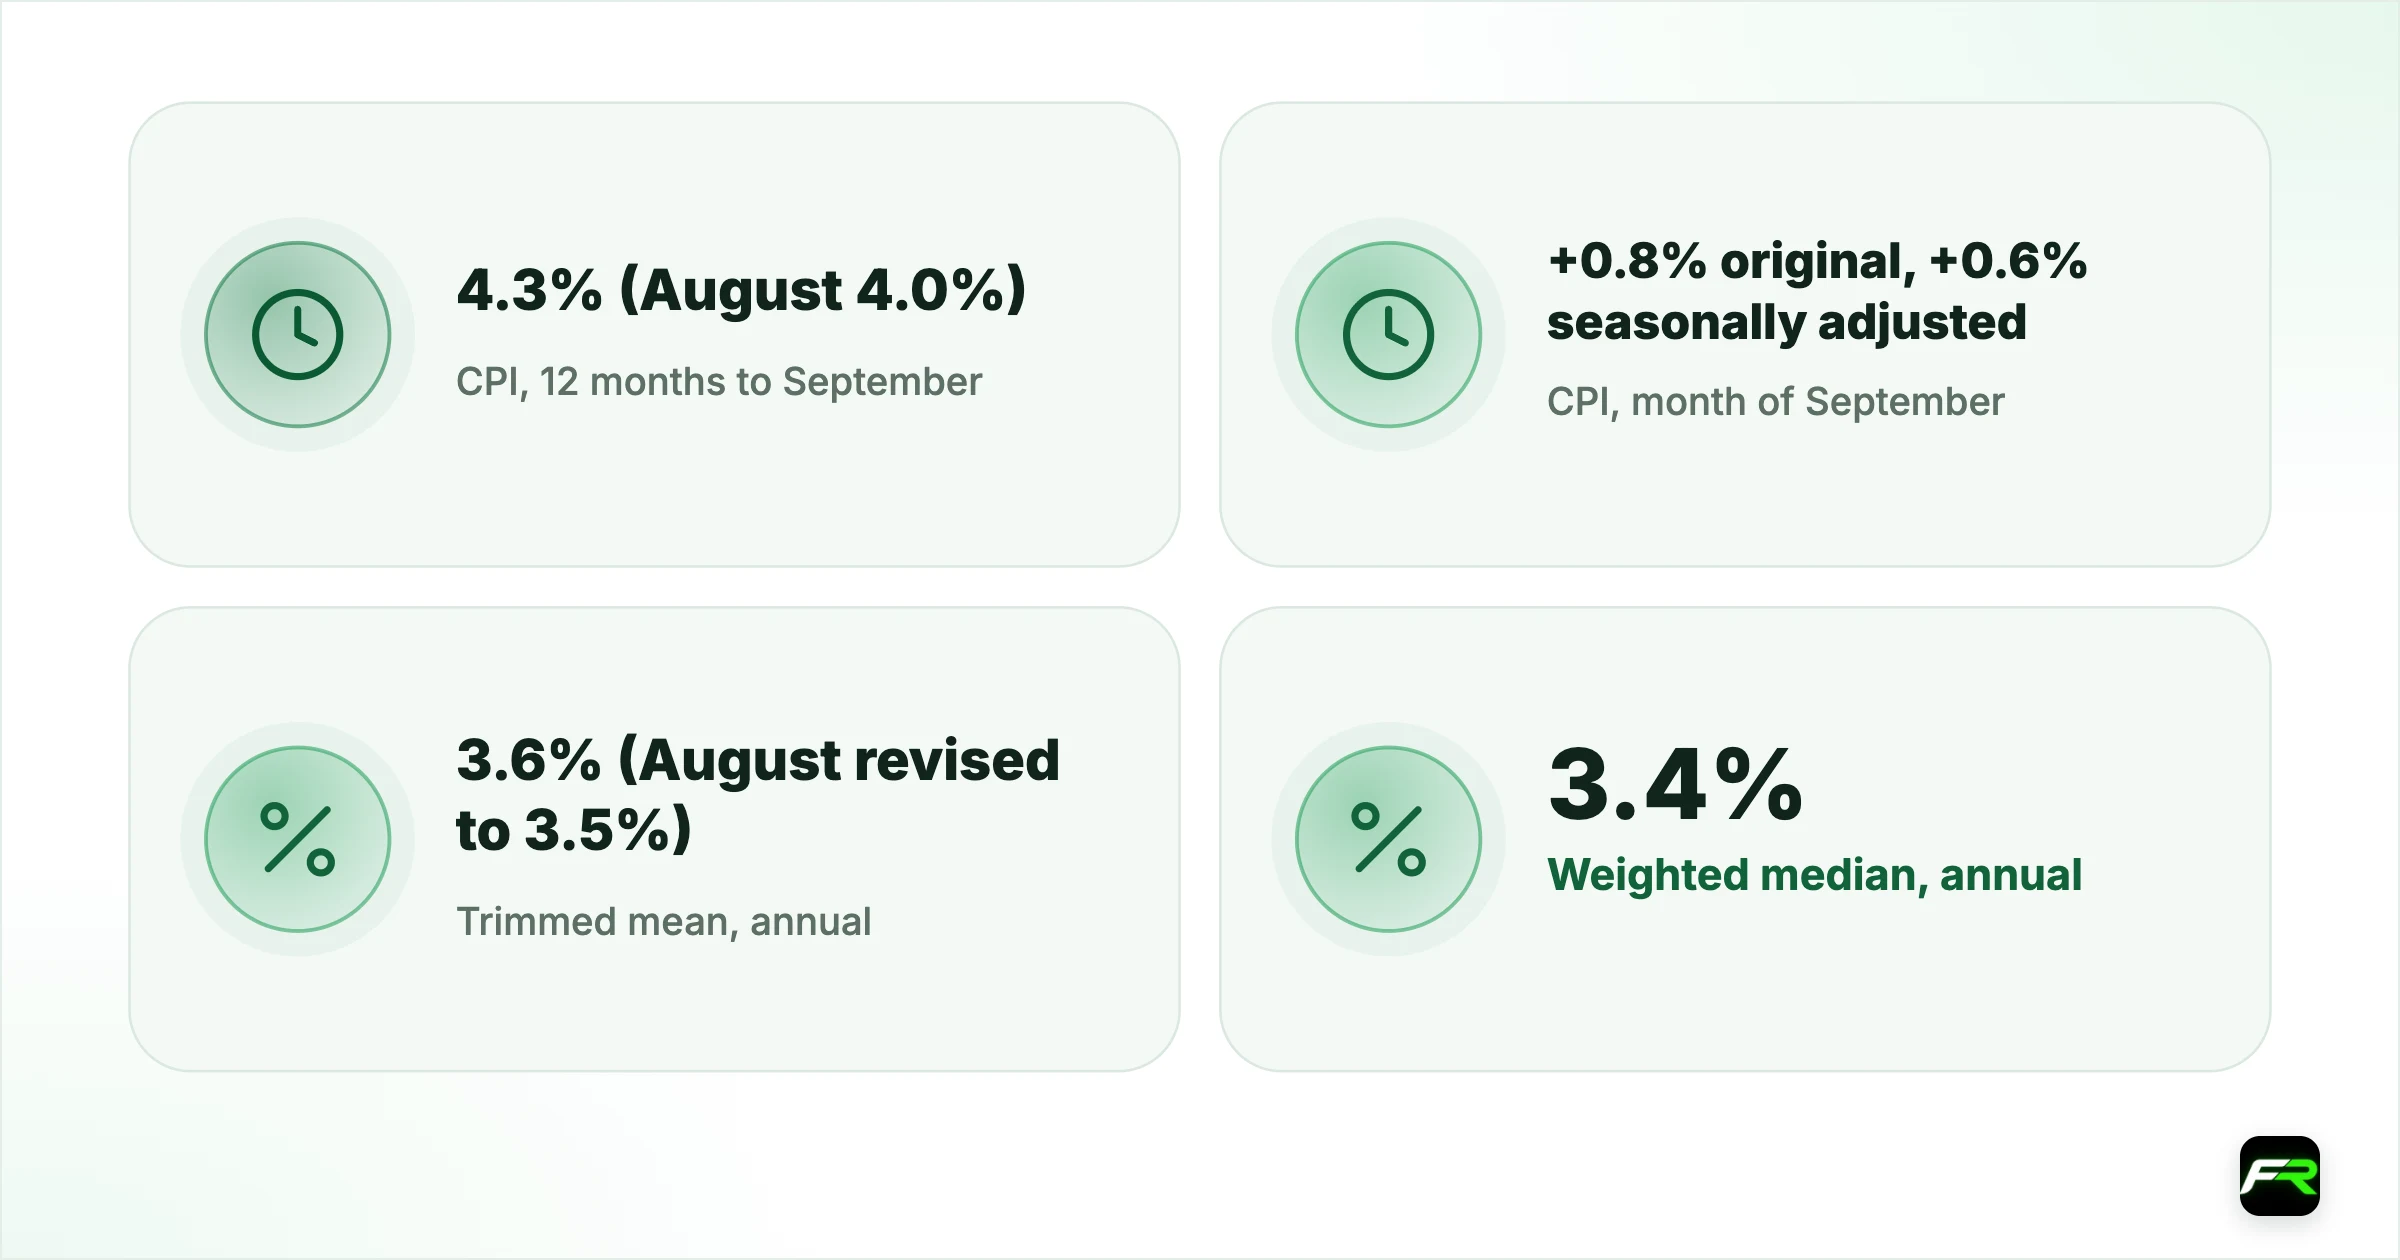
Underlying inflation edged up too. The trimmed mean, which strips out the biggest price rises and falls each month, rose to 3.6% a year from a revised 3.5% in August. On the quarterly basis the Reserve Bank of Australia used before October 2025, the trimmed mean rose 1.0% in the September quarter and 3.7% over the year, up from 3.6% in June.
The figures land six days before the RBA's next decision on Tuesday 3 November. The cash rate is 4.60% after four rises this year, the latest on 29 September, and both the headline and the core numbers remain well above the 2% to 3% target band.
| CPI, 12 months to September | 4.3% (August 4.0%) |
|---|---|
| CPI, month of September | +0.8% original, +0.6% seasonally adjusted |
| Trimmed mean, annual | 3.6% (August revised to 3.5%) |
| Weighted median, annual | 3.4% |
| Quarterly trimmed mean, Sep quarter | +1.0%, 3.7% a year (June 3.6%) |
| CPI, September quarter | +1.3% (June quarter +0.6%) |
| Transport, annual | 8.7% (+3.0% in September) |
| RBA cash rate | 4.60%; next decision Tue 3 November |
What drove September's rise
Fuel is the common thread. Transport rose 3.0% in September and 8.7% over the year, and the ABS's contribution data show it added about 1.0 percentage point to the annual rate, up from 0.6 points in August. Tradable goods, the part of the basket most exposed to world prices such as fuel and imported food, rose 4.0% over the year, sharply up from 2.9% in August.
Recreation and culture was the other big mover, up 3.8% in the month and 4.5% over the year. Seasonal swings in holiday travel often drive that group, and the ABS's measure that excludes volatile items and holiday travel rose 3.6% a year, slightly below the 3.7% for the version that excludes only fruit, vegetables and fuel.
Some groups were soft. Food prices were flat in the month and 3.2% higher over the year, clothing and footwear fell 2.7% in September, and furnishings and household equipment were up only 0.8% on the year. Housing, the largest group, slowed to 5.2% from 5.7% in August.
Core inflation and the quarterly numbers
The RBA watches underlying inflation more closely than the headline, because fuel can swing the total by a full percentage point in a few months. Monthly, the trimmed mean rose 0.3% in September and 3.6% over the year, while the weighted median was 3.4%. Both are above the top of the target band and neither has fallen much in 2026.
Because September ends a quarter, the ABS also added quarterly data to its tables. The all groups index rose 1.3% in the September quarter, after 0.6% in June and 1.4% in March. In Appendix 1a, where the ABS keeps the trimmed mean on the methods used before October 2025, the quarterly trimmed mean rose 1.0% for a second straight quarter and 3.7% over the year. The weighted median rose 1.0%, or 3.6% a year.
A 1.0% quarterly rise in core prices is roughly a 4% annual pace, well above the 2.5% midpoint the RBA aims for. That is the number many analysts compare with the bank's own forecasts, and it points in the same direction as the monthly data: underlying inflation is not cooling.
Goods, services and the domestic picture
Goods prices rose 4.6% over the year and services 4.1%. Services jumped 1.3% in September alone, partly because of travel. Non-tradable inflation, the domestically driven part of the basket that includes rents, insurance and education, held at 4.5%.
Non-discretionary items, the things households must buy such as fuel, food, utilities and rent, rose 5.2% a year, against 3.2% for discretionary spending. That gap matters for the economy: essential costs are squeezing budgets, which can slow other spending even while the inflation numbers stay high. Across the eight capital cities, annual inflation ranged from 4.0% in Melbourne to 5.3% in Hobart.
Seasonal adjustment tells a similar story. The seasonally adjusted index rose 0.6% in the month and 4.4% over the year, a touch above the original 4.3%. Media headlines normally quote the original annual rate, so check which series a figure comes from before you compare it with forecasts.
The arithmetic for October is also worth knowing. Prices were flat in October 2025, according to the ABS series, so any rise in October 2026 would lift the annual rate above 4.3% unless other months are revised. That is a simple base effect, not a forecast, but it means headline inflation could stay above 4% into the RBA's December meeting. The ABS will also move the CPI to the fourth Wednesday of each month from February 2027, slightly earlier than now.
What it means for the RBA on 3 November
In its 29 September statement the RBA said that “inflation remains elevated and some of the upside risks flagged in August are materialising.” It also noted that “higher fuel prices have partially been passed through to prices of other goods and services” and said it “will continue to do what it considers necessary to bring inflation sustainably back to target, including increasing the cash rate target further if needed.”
September's data give that warning more weight. Headline inflation went up rather than down, and core measures held near their highs. Against that, unemployment rose to 4.7% in September and food and clothing prices were soft, which argues for patience. The RBA has not said what it will do; the decision comes at 2:30pm Sydney time on 3 November, 03:30 UTC.
| RBA outcome on 3 November | What it would signal | Possible AUD reaction |
|---|---|---|
| Fifth rise to 4.85% | Board acts on core inflation near 3.7% | Aussie likely firmer |
| Hold with a firm warning | Waits for more data, keeps hikes on the table | Limited, some support |
| Hold with a softer tone | More weight on jobs and weak spending | Aussie could slip |
The table is FX Recap's own framework, not a forecast and not an RBA statement.
What it means for traders
AUD/USD, derived from ECB euro reference rates, was 0.7032 on Tuesday 27 October, just under the 0.7034 reached on 21 October and right at its 100-day average. Wednesday's reference rate is set around 14:15 CET, so the official record of the reaction comes later; live prices react as soon as the data come out, which was 00:30 UTC.
- Read the trimmed mean before the headline. A fuel-driven headline with steady core is a weaker signal for the RBA than a rise in both.
- Watch AUD/NZD as well. New Zealand's central bank held rates 30 minutes after this release in a split vote; see our RBNZ decision story.
- Remember the Fed decides at 18:00 UTC today. A firm Fed can outweigh a strong Australian number for AUD/USD.
- Expect wide spreads in the Asian session and avoid market orders in the first minute after Australian releases.
- Our economic calendar shows the RBA decision and other releases in your time zone.
Suppose you plan to buy AUD/USD on a close above 0.7045, with a stop 35 pips lower at 0.7010. On a $5,000 account with a 1% risk limit you can lose $50, so the position should be about 14,000 units, since each pip on that size is worth about $1.40. If you hold into the RBA on 3 November, a surprise can gap the price past your stop, so consider halving the size. The <a href="/position-size-calculator">position size calculator</a> does the sums.
See today's levels in our AUD/USD analysis, and our CPI preview for the background.
Inflation data and rate decisions can move currencies sharply, and prices can gap past stop orders in the thin Asian session. Leverage magnifies losses as well as gains, so trade only with money you can afford to lose.
All CPI figures come from the Australian Bureau of Statistics release for September 2026, its Table 17 quarterly data and Appendix 1a. Quotations come from the RBA's statement of 29 September 2026, and the decision date from the RBA's board schedule. AUD/USD is derived from ECB euro reference rates. The outcome table is FX Recap's own framework. This is news, not investment advice.
Frequently asked
What was Australia's inflation rate in September 2026?
Consumer prices rose 4.3% in the 12 months to September 2026, up from 4.0% in August, according to the Australian Bureau of Statistics. Prices rose 0.8% in the month in original terms.
What was the trimmed mean in September 2026?
The monthly trimmed mean was 3.6% a year, up from a revised 3.5% in August. On the quarterly basis used before October 2025, the trimmed mean rose 1.0% in the September quarter and 3.7% over the year.
Why did Australian inflation rise in September?
Mostly fuel. Transport prices rose 3.0% in the month and 8.7% over the year. Recreation and culture, which includes holiday travel, rose 3.8% in the month, while food was flat and clothing fell.
Will the RBA raise rates on 3 November 2026?
The RBA has not said. In September it said it would raise the cash rate further if needed. Higher headline and core inflation make another rise more likely, while rising unemployment argues for patience.
Sources: Australian Bureau of Statistics: Consumer Price Index, Australia, September 2026 · Reserve Bank of Australia: Monetary Policy Decision, 29 September 2026 · Australian Bureau of Statistics: CPI Appendix 1a, quarterly trimmed mean (September 2026) · Reserve Bank of Australia: Board meeting schedules · Australian Bureau of Statistics: CPI Table 17, quarterly data (September 2026) · European Central Bank: euro foreign exchange reference rates
The team behind this guide
Researched, checked and approved by five forex specialists
Every guide is written, fact-checked and edited before it goes live, and updated when the facts change. Spotted an error? Tell us.