IC Markets

 3:09
 2:39
 2:10
 2:18
 3:43
 8:42






































US Producer Prices for October Are Due Friday After September's 1.3% Jump, the Biggest Since 2022
The BLS publishes October producer prices on 13 November at 13:30 UTC, a month after final demand prices rose 1.3% and 6.3% over a year.
 WriterNafish PialJournalist & FX WriterJournalist · forex news and market writing View profileAbout Nafish →

 ReportingJawad Bin GoniPR & ReporterPR and reporting · media enquiries and press coverage View profileAbout Jawad →

 EditingAbir KhanWriterWrites the guides · checks every figure against primary sources View profileAbout Abir →

 Fact-checking & riskJannatul FerdaushFact-Checker & Risk AnalystFact-checks every figure · risk analysis · Applied Statistics, University of Dhaka View profileAbout Jannatul →

 Trading reviewJowel RanaForex TraderForex trader · reviews guides from a trader's view View profileAbout Jowel →

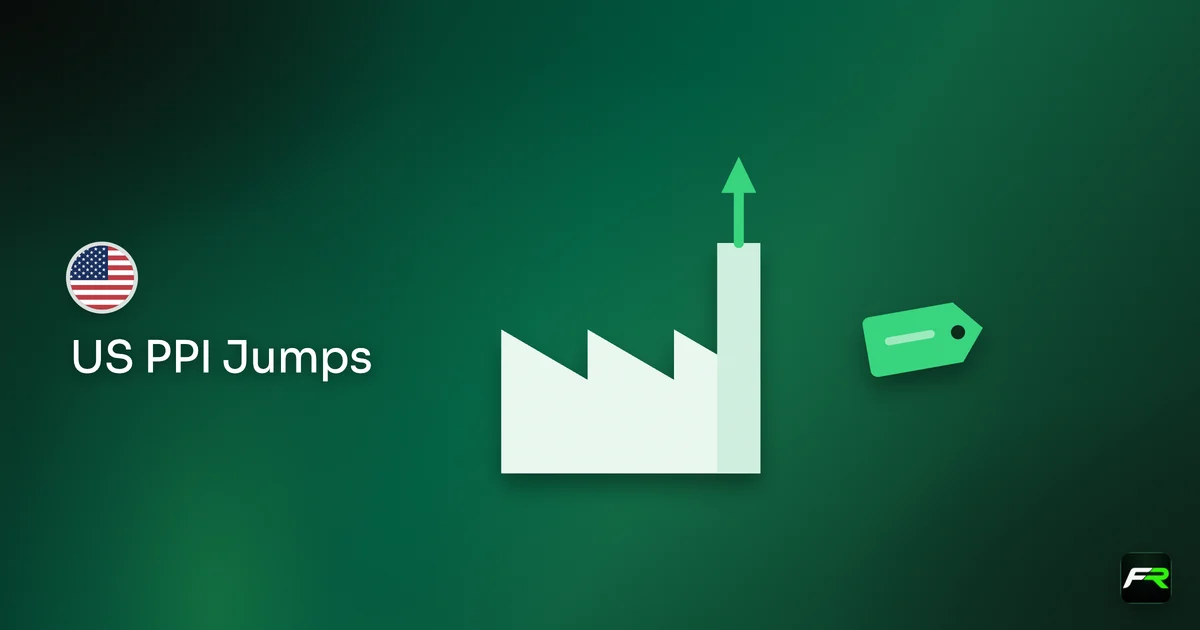
US producer prices for October come out on Friday 13 November at 08:30 New York time, 13:30 UTC, the Bureau of Labor Statistics has confirmed. The report follows a very large September reading. Final demand prices, the headline measure of what US businesses receive for goods and services, rose 1.3% that month, the biggest monthly increase since March 2022.
Over 12 months the index climbed 6.3% before seasonal adjustment, the most since December 2022. With consumer prices up 0.4% in October and the dollar rising against every major currency since that report, Friday's figure is the last big US inflation number of the week and could extend or reverse the move.
| PPI final demand, monthly (BLS) | +1.3% in September (August +0.5%) |
|---|---|
| PPI final demand, 12 months (BLS) | 6.3% in September (August 5.6%) |
| Final demand less foods, energy and trade (BLS) | +0.5% in September (August +0.3%) |
| Final demand energy (BLS) | +10.8% in September (August +4.5%) |
What drove September's jump
Energy did most of the work. Final demand goods prices rose 2.6%, the largest increase since the BLS began calculating the series in December 2009, and the bureau says over 80% of that rise came from energy, which jumped 10.8%. Gasoline alone climbed 20.3% and accounted for half of the goods increase. Diesel fuel, jet fuel and crude petroleum rose too, while chicken eggs fell 39.7%.
Services were firm as well. Final demand services rose 0.8%, the most since April. Nearly half of that came from a 1.4% rise in trade margins, the gap between what wholesalers and retailers pay and what they charge. Transportation and warehousing prices climbed 3.4%, and other services 0.3%.
The measure that strips out food, energy and trade services, often used as a core reading, rose 0.5% after 0.3% in August, and 5.0% over 12 months. That figure matters more for the Federal Reserve than the energy-driven headline, because it shows whether price pressure is spreading beyond fuel.
This year's monthly readings
September's figure stands out even in a year of high readings. The table shows the monthly change in final demand prices, seasonally adjusted, as published in the September release, which includes revisions to May through August.
| Month | Final demand, monthly change |
|---|---|
| January | +0.6% |
| February | +0.5% |
| March | +0.8% |
| April | +1.1% |
| May | +0.5% |
| June | -0.1% |
| July | +0.2% |
| August | +0.5% |
| September | +1.3% |
Two spikes show up: March and April, then September. Both line up with sharp moves in energy, which rose 10.5% in March, 7.1% in April and 10.8% in September on the BLS figures. Months without an energy surge, such as June and July, were much calmer.
Clues for October
Official data released since September give some hints, though none of them is a forecast. In the October consumer price report, energy rose only 0.7% after 5.2% a month earlier, and gasoline 1.0% after 9.1%, both seasonally adjusted. Retail pump prices measured by the Energy Information Administration averaged $4.310 a gallon for regular gasoline in October, against $4.355 in September.
If producer energy prices follow the same path, the headline PPI should rise far less than in September. That is a reading of the direction, not a number. Trade margins are also volatile: a big rise one month is often followed by a fall, because they measure a gap between two prices that can move at different speeds.
Core consumer prices rose 0.3% in October for a third month, so underlying inflation has not cooled. A second strong reading in the PPI measure that excludes food, energy and trade would tell markets that business costs are still climbing, and some of those costs can reach shoppers later.
Why the Fed and the dollar care
Producer prices feed into the Fed's preferred gauge. The Bureau of Economic Analysis uses some PPI series, such as airline fares, medical services and portfolio management fees, when it builds the personal consumption expenditures price index, so analysts often update their PCE estimates within minutes of the PPI release.
The timing raises the stakes. The Fed held its target range at 3.75% to 4.00% on 28 October, with two officials voting for a rise, and its next decision is on 9 December. November's CPI is due a day after that meeting, so October's CPI and PPI are the last full set of price data officials will see. The 2-year Treasury yield, which follows Fed expectations closely, closed at 4.73% on 10 November, up 17 basis points on the CPI day.
For currencies, the pattern after the CPI report is the guide. The dollar rose against all six major currencies on the ECB's reference rates, and EUR/USD fell to 1.1127, its lowest since May 2025. A hot PPI would support that move; a soft one, especially in the core measure, could trigger a pullback as traders trim bets on a December rise. Our dollar report has the details and levels.
How to read the release in the first minutes
The BLS release opens with the seasonally adjusted change in final demand prices, then the 12-month change before seasonal adjustment. Headline numbers move markets first, but they can mislead when energy swings hard, as it did in September. Table A of the release splits final demand into goods, with food and energy shown separately, and services, with trade, transportation and other services shown separately.
Three figures tell you most of what you need. First, the core measure that excludes food, energy and trade services, which shows underlying pressure. Second, final demand services excluding trade, because service costs are stickier than fuel prices. Third, the revisions: the BLS revises the previous months as late reports come in, and the September release changed the May to August figures. A soft October with an upward revision to September can mean less than it seems.
Markets also react to how the number compares with what traders expected. Banks and news agencies publish consensus forecasts before the release, but those are not official figures, so we do not quote them here. What matters for your trading is the direction of the surprise and whether it confirms or fights the message of Tuesday's CPI.
What it means for traders
- Mark 13:30 UTC on Friday. US data at that time often move EUR/USD and USD/JPY by tens of pips within a minute, and spreads widen.
- Look past the headline. With energy prices cooling in October, the measure that excludes food, energy and trade is the better guide to whether inflation pressure is broad.
- Compare the report with CPI. Strong producer prices alongside 0.3% core consumer inflation would strengthen the case for a December Fed rise; weak ones would ease it.
- Watch the 2-year Treasury yield after the release. It is the quickest read on how the market changes its Fed view, and the dollar tends to follow it.
- Use our economic calendar to see the release in your own time zone, and our USD/JPY analysis for levels.
Say you hold a USD/JPY position at 159.20 into the release with a stop 40 pips away, at 158.80. A standard lot of USD/JPY is worth about 1,000 yen a pip, roughly $6.30 at that rate, so a full lot risks about $252. If the market gaps 20 pips through your stop in the first second, the loss grows by half, to about $378. Halving the size or waiting until a few minutes after 13:30 UTC cuts that risk.
Prices can jump or gap when US data are released, and stop orders may be filled at worse prices than set. Leverage magnifies losses as well as gains, so only trade money you can afford to lose. This is news and education, not a forecast or a recommendation to buy or sell.
PPI figures are from the BLS Producer Price Index release for September 2026 (USDL-26-1576, 15 October 2026), which also gives the October release date. CPI figures are from the BLS release of 10 November 2026, gasoline prices from the EIA weekly retail series, yields from the US Treasury and currency rates from the European Central Bank (ECB).
Cite this guide
FX Recap, "US Producer Prices for October Are Due Friday After September's 1.3% Jump, the Biggest Since 2022", updated 12 November 2026, https://fxrecap.com/forex-news/top-stories/us-ppi-october-2026-preview
Free to quote with a link. Journalists: data and comment in our press room.
Frequently asked
When is the US PPI for October 2026 released?
The Bureau of Labor Statistics publishes the October Producer Price Index on Friday 13 November 2026 at 08:30 New York time, which is 13:30 UTC.
What was the September PPI?
Final demand prices rose 1.3% in September, seasonally adjusted, the largest rise since March 2022, and 6.3% over 12 months. Prices excluding food, energy and trade services rose 0.5%.
Why does PPI matter for forex?
Producer prices show cost pressure in the economy and feed into the PCE price index the Fed targets. A strong reading can lift Treasury yields and the dollar; a weak one can do the reverse.
What is core PPI?
Traders often use final demand less foods, energy and trade services as core PPI. It removes the most volatile parts of the index, so it shows broader price trends.
Sources: US Bureau of Labor Statistics: Producer Price Index, September 2026 · US Bureau of Labor Statistics: Consumer Price Index, October 2026 · US Energy Information Administration: gasoline and diesel fuel update · US Treasury: daily par yield curve rates, November 2026 · European Central Bank: euro foreign exchange reference rates
The team behind this guide
Reported, written, edited and checked by five FX Recap specialists
Every guide is written, fact-checked and edited before it goes live, and updated when the facts change. Spotted an error? Tell us.