IC Markets





































US 2-Year Note Auction: $69 Billion Sells at 4.708% as Domestic Buyers Step In Before the Fed
Monday's sale cleared below September's 4.787% two days before the Fed, but foreign-type demand fell to 45.7%. Here is what the bidding says.
 WriterAbir KhanWriterWrites the guides · checks every figure against primary sources View profileAbout Abir →

 Market analysisTanbir Habib RiyadForex & Crypto AnalystForex and crypto analyst · technical and fundamental analysis View profileAbout Tanbir →

 Fact-checking & riskJannatul FerdaushFact-Checker & Risk AnalystFact-checks every figure · risk analysis · Applied Statistics, University of Dhaka View profileAbout Jannatul →

 Trading reviewJowel RanaCo-Founder & Forex TraderCo-founder · forex trader · reviews guides from a trader's view View profileAbout Jowel →

 Final approvalRanjan NiskrityFounder, Owner & Forex TraderFounder and owner · forex trader · signs off every guide View profileAbout Ranjan →

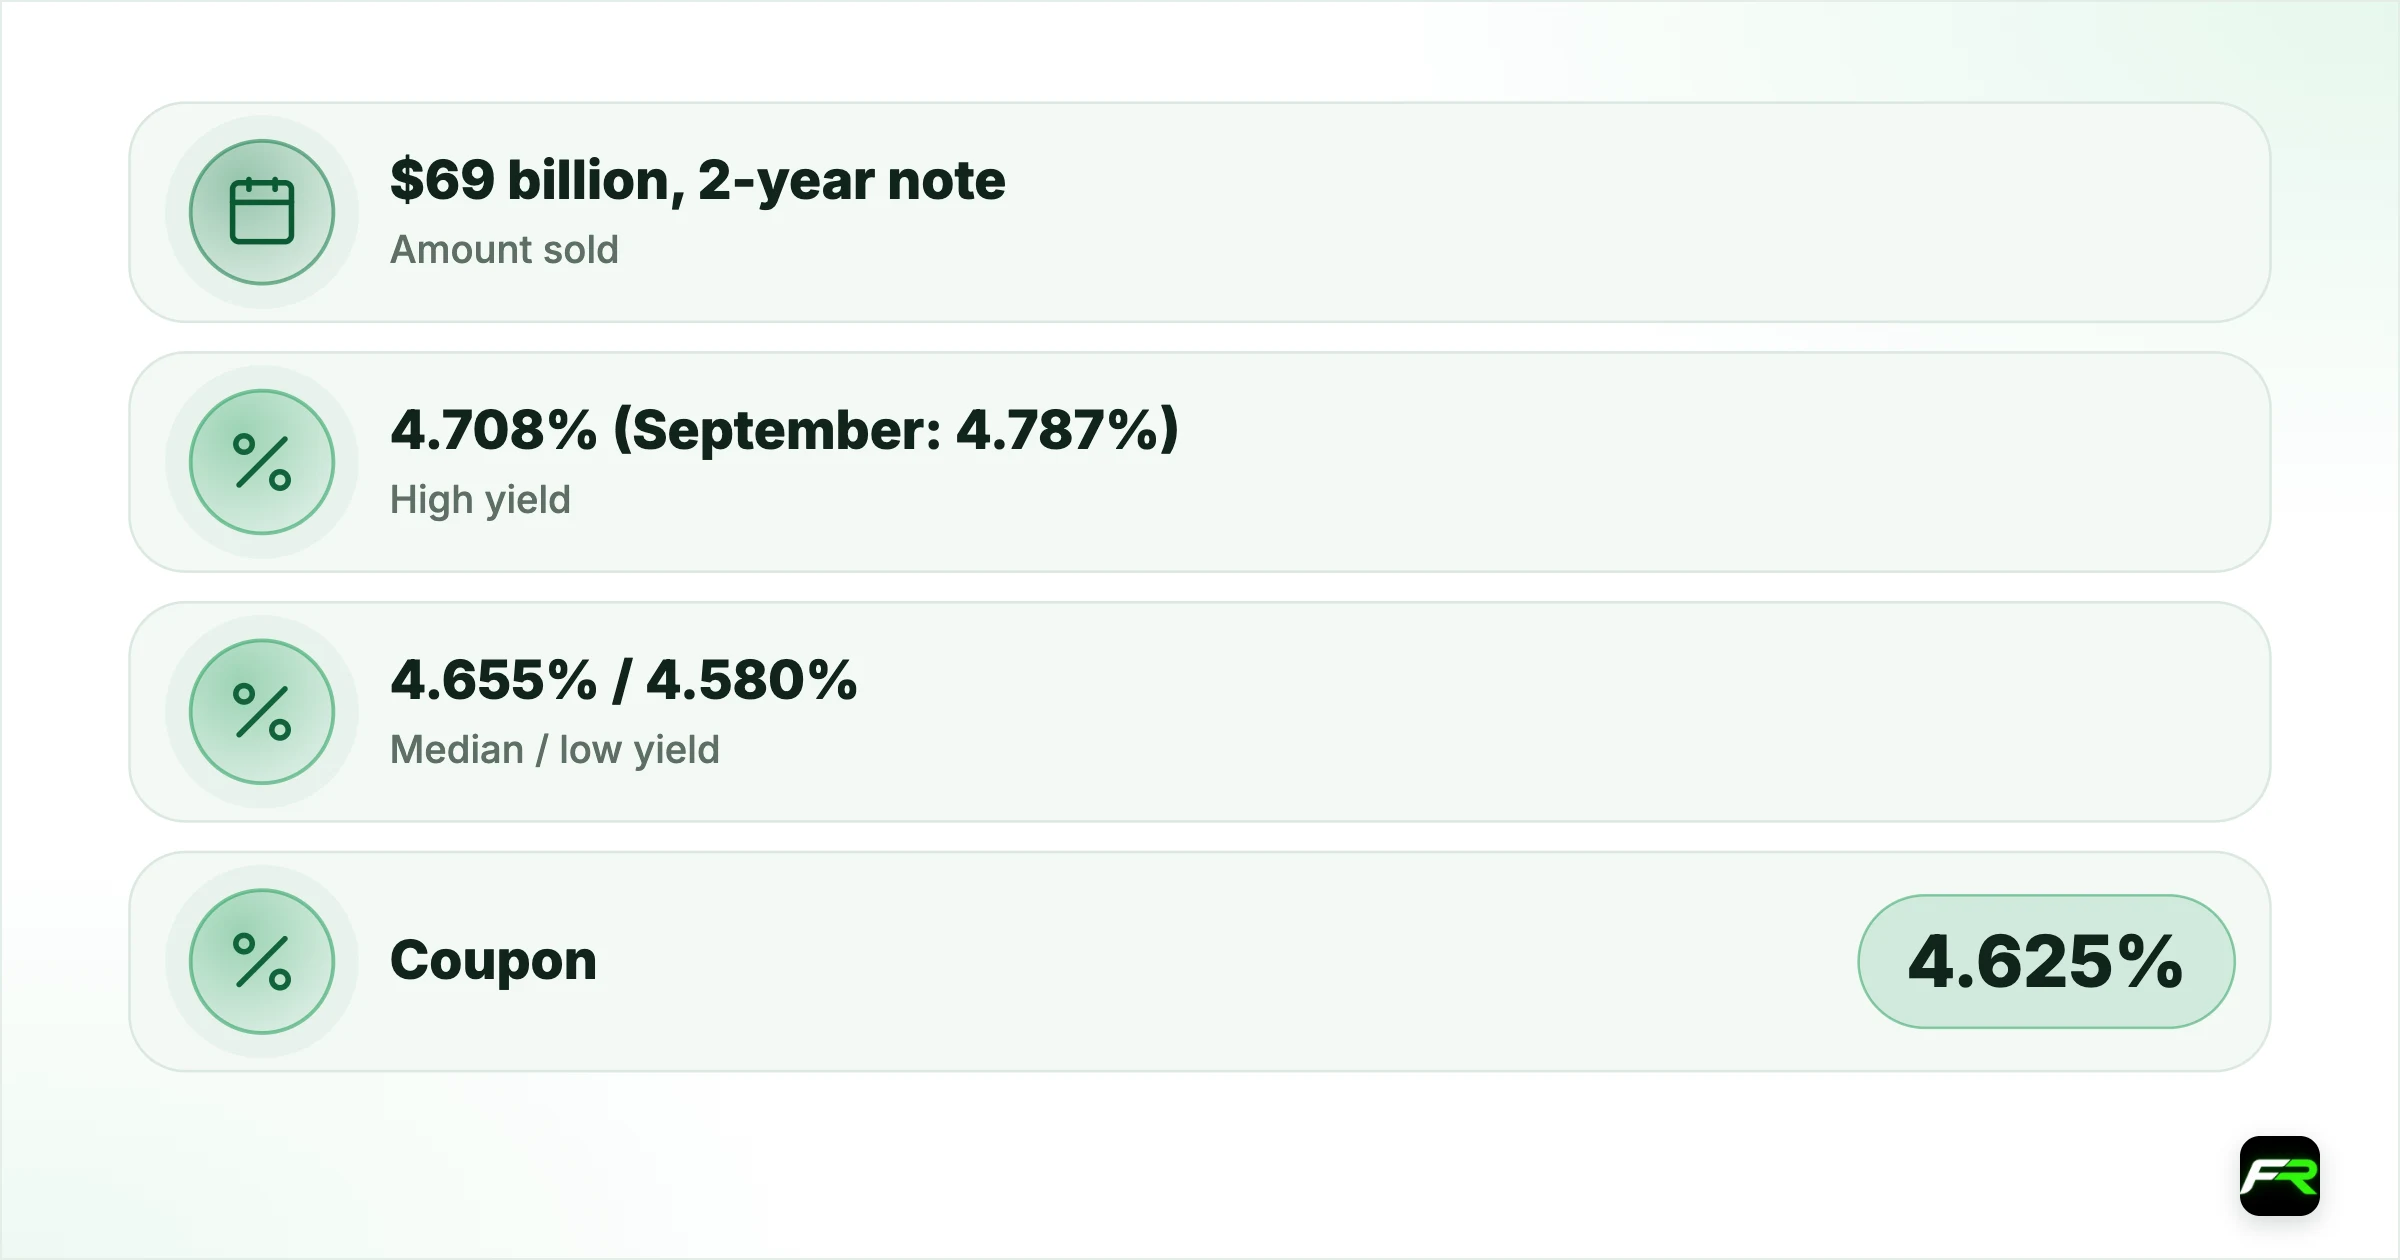
The US Treasury sold $69 billion of new two-year notes on Monday 26 October at a high yield of 4.708%, according to its official auction results. That is lower than the 4.787% paid at September's sale, but still about 70 basis points above the top of the Federal Reserve's 3.75% to 4.00% target range, two days before the Fed announces its next decision.
Two-year yields are the part of the bond market that tracks expected Fed policy most closely, so this auction is a check on how investors are pricing the next two years of rates. Monday's bidding was solid overall, with a bid-to-cover ratio of 2.59, but the mix of buyers shifted sharply.
| Amount sold | $69 billion, 2-year note (CUSIP 91282CRU7) |
|---|---|
| High yield | 4.708% (September: 4.787%) |
| Median / low yield | 4.655% / 4.580% |
| Coupon | 4.625% |
| Bid-to-cover | 2.59 (September 2.63, August 2.60) |
| Indirect bidders | 45.7% of competitive awards (September 57.8%) |
| Direct bidders | 41.3% (September 29.0%) |
| Primary dealers | 13.0% (September 13.2%) |
What the auction results show
Treasury accepted bids up to 4.708% and set the coupon at 4.625%, so each note sold at 99.843155 per 100 of face value. The median accepted yield was 4.655% and the lowest 4.580%. Bidders at the high yield received 80.83% of what they asked for, a sign that a lot of demand was bunched at the top of the range.
Total bids for the $69 billion offering were about 2.59 times the amount sold, close to August's 2.60 and September's 2.63. The Fed's own portfolio, known as SOMA, also rolled $7.67 billion of maturing debt into the new note on top of the public offering, which is normal and does not affect the auction result.
Two-year yields have eased since the September sale. The Treasury's daily par yield curve put the two-year at 4.68% at the close on Monday, down from 4.81% on 21 October and roughly in line with 4.65% on 22 October. The 10-year closed at exactly 5.00%.
Who bought the notes
Treasury splits competitive buyers into three groups. Indirect bidders place orders through dealers and include foreign central banks and many overseas investors. Direct bidders buy for their own account and are often domestic funds. Primary dealers are the banks obliged to bid at every auction, and they take what others do not.
On Monday indirect bidders received 45.7% of the competitive awards, down from 57.8% in September and 66.0% in August. Direct bidders took 41.3%, up from 29.0% and 23.1%. Dealers ended with 13.0%, almost the same as September's 13.2%, which means the auction did not lean on the banks any more than usual.
The shift from indirect to direct buyers is the striking part. A falling indirect share is often read as weaker foreign demand, but here domestic buyers filled the gap at a lower yield, so the auction still cleared smoothly. One auction does not make a trend, and Treasury's data show who bought, not why.
How a Treasury note auction works
Treasury sells notes in a single-price auction. Large investors send competitive bids stating the yield they will accept, to three decimal places, and the bids are filled from the lowest yield upwards until the offering is covered. Everyone who is filled then pays the same price, set by the highest accepted yield, which is why the result is reported as the “high yield”.
Smaller buyers can send noncompetitive bids instead. They agree to take whatever yield the auction sets and, under the terms of this sale, could buy up to $10 million each. Noncompetitive bids closed at noon New York time and competitive bids at 1pm. On Monday, individual buyers through TreasuryDirect and other retail channels received about $439 million of notes this way.
No single bidder can take more than 35% of the offering, which for this sale capped any one buyer at $24.15 billion. That rule stops one large investor from cornering a new issue and helps keep the price fair for everyone else.
Two numbers tell you quickly how well an auction went. The bid-to-cover ratio compares total bids with the amount sold; the higher it is, the deeper the demand. The tail is the gap between the high yield and where the same note traded in the market just before the deadline. Treasury's results do not report that pre-auction level, so the tail can only be measured against live market data, which is why we do not state one here.
Why the auction matters for currencies
The two-year yield is a key input into the gap between US and foreign interest rates, and that gap drives a large share of moves in USD/JPY and EUR/USD. A two-year yield well above the Fed's range suggests investors do not expect cuts soon, and that has kept the dollar supported this month.
Reference rates show the effect. USD/JPY, derived from ECB euro reference rates, was 157.45 on 26 October, near its 20-day average of 157.88, while EUR/USD was 1.1188, close to its 2026 low of 1.1177 set on 7 October. Our story on last week's drop in yields covers the earlier move in the curve.
The two pairs are in different places, though. EUR/USD sits just 11 pips above the bottom of its 20-day range of 1.1177 to 1.1355 on the reference rates, while USD/JPY is near the middle of its 20-day range of 156.80 to 158.60. Short-dated yields well above the Fed's range give the dollar a cushion, but they also suggest that much of the support for the currency is already priced in before Wednesday.
Steady demand for two-year paper at a yield below September's suggests the market is not adding more Fed hikes before Wednesday's decision. A weak auction with a big dealer share would have pointed the other way. Our Fed preview sets out what the central bank could do.
The rest of this week's Treasury supply
Monday's sale is the first of a heavy week. TreasuryDirect lists a $70 billion five-year note auction on Tuesday 27 October, a $30 billion two-year floating rate note on Wednesday 28 October, and a $44 billion seven-year note on Thursday 29 October, all settling on 2 November.
| Auction | Date | Size |
|---|---|---|
| 2-year note | Mon 26 October | $69 billion, sold at 4.708% |
| 5-year note | Tue 27 October | $70 billion |
| 2-year floating rate note | Wed 28 October | $30 billion |
| 7-year note | Thu 29 October | $44 billion |
The floating rate note on Wednesday pays interest that resets with the 13-week bill rate, so its result says little about expected Fed policy and rarely moves currencies. The five-year and seven-year notes matter more, because they cover the stretch of the curve where expectations for the Fed's path over the next few years are priced.
The seven-year sale closes on the same day as the ECB decision and US third-quarter GDP, so Thursday could be the busiest day of the week for yields and for the dollar. A weak result there, on top of strong growth or inflation data, could lift yields across the curve and give the dollar a second push after the Fed.
What it means for traders
Auction results come out shortly after the 13:00 New York close for bids, which is 17:00 UTC this week, because US clocks change only on 1 November. They can move yields and the dollar in the minutes after release, but the effect is usually smaller than a data surprise.
- Compare the high yield with the yield just before 13:00 New York time. A result well above it, known as a tail, signals weak demand.
- Watch the dealer share. A rise well above 15% would suggest investors are stepping back.
- Keep the Fed in view. Wednesday's decision at 18:00 UTC will matter far more for USD/JPY than any single auction.
- Use the Treasury's own daily yield curve rather than social media screenshots for levels.
- Check the timing of every release in your zone on our economic calendar.
Suppose you hold a USD/JPY long at 157.40 with a stop at 156.80, 60 pips away, into the five-year auction. On a $6,000 account with a 1% risk limit you can lose $60. Each pip on 10,000 units is worth roughly $0.64 at this rate, so about 15,600 units keeps the risk near $60. If you plan to hold through Wednesday's Fed, consider halving that, since a policy surprise can move the pair far more than 60 pips. The <a href="/position-size-calculator">position size calculator</a> handles the conversion.
See today's levels in our USD/JPY analysis and EUR/USD analysis.
Bond auctions and central bank decisions can move currencies quickly, and prices can gap past stop orders. Leverage magnifies losses as well as gains, so trade only with money you can afford to lose.
Auction results and the week's schedule come from the US Treasury's TreasuryDirect auction data. Closing yields are from the Treasury's daily par yield curve. Exchange rates are ECB euro reference rates or derived from them. The bidder shares are FX Recap's calculation from the Treasury's awarded amounts. This is news, not investment advice.
Frequently asked
What was the yield at the US 2-year note auction on 26 October 2026?
The US Treasury sold $69 billion of two-year notes at a high yield of 4.708%, with a 4.625% coupon and a bid-to-cover ratio of 2.59, according to TreasuryDirect.
Was the 2-year auction strong or weak?
Demand was solid: the bid-to-cover ratio was close to recent sales and primary dealers took 13.0%, about the same as September. The indirect share fell to 45.7%, but direct bidders made up the difference.
Why does the 2-year yield matter for forex?
The two-year yield reflects expected Fed policy over the next two years, and the gap between US and foreign short-term yields is a major driver of pairs such as USD/JPY and EUR/USD.
What other Treasury auctions are due this week?
TreasuryDirect lists a $70 billion five-year note on 27 October, a $30 billion two-year floating rate note on 28 October and a $44 billion seven-year note on 29 October.
Sources: US Treasury, TreasuryDirect: Auction results, 2-year note, 26 October 2026 · US Treasury: Daily Treasury par yield curve rates · TreasuryDirect: Auctioned securities data · Federal Reserve: FOMC meeting calendar · TreasuryDirect: Upcoming auctions · European Central Bank: euro foreign exchange reference rates
The team behind this guide
Researched, checked and approved by five forex specialists
Every guide is written, fact-checked and edited before it goes live, and updated when the facts change. Spotted an error? Tell us.