IC Markets






































UK Unemployment Falls to 4.7% as Vacancies Drop and Total Pay Growth Slows
More people found work over the summer, yet firms are advertising fewer jobs and bonuses are shrinking, a mixed message for the Bank of England.
 WriterAbir KhanWriterWrites the guides · checks every figure against primary sources View profileAbout Abir →

 Market analysisTanbir Habib RiyadForex & Crypto AnalystForex and crypto analyst · technical and fundamental analysis View profileAbout Tanbir →

 Fact-checking & riskJannatul FerdaushFact-Checker & Risk AnalystFact-checks every figure · risk analysis · Applied Statistics, University of Dhaka View profileAbout Jannatul →

 Trading reviewJowel RanaCo-Founder & Forex TraderCo-founder · forex trader · reviews guides from a trader's view View profileAbout Jowel →

 Final approvalRanjan NiskrityFounder, Owner & Forex TraderFounder and owner · forex trader · signs off every guide View profileAbout Ranjan →

Britain's unemployment rate fell to 4.7% in the three months to August, the Office for National Statistics said on Tuesday 20 October. That is 0.1 percentage points lower than both the previous quarter and a year earlier, and below the 4.9% the ONS reported for May to July a month ago. More people were in work, fewer were sitting outside the labour force, and the employment rate rose to 75.3%.
Other parts of the report were softer. Job vacancies fell by 21,000 to 691,000 in July to September, the largest quarterly drop since the start of the year. Growth in total pay, which includes bonuses, slowed to 3.7%, the weakest rate since late 2020. The ONS summed it up plainly: the labour market “remains broadly flat in 2026”.
Sterling still had a good day. GBP/USD rose from about 1.3330 before the 07:00 UK release to 1.3359 within the hour, and EUR/GBP slipped from 0.8423 to 0.8407, a sign the move was about the pound and not only the dollar. The pair then climbed to 1.3409 in the New York morning, as the dollar weakened across the board, and was trading near 1.3380 at 18:00 UTC.
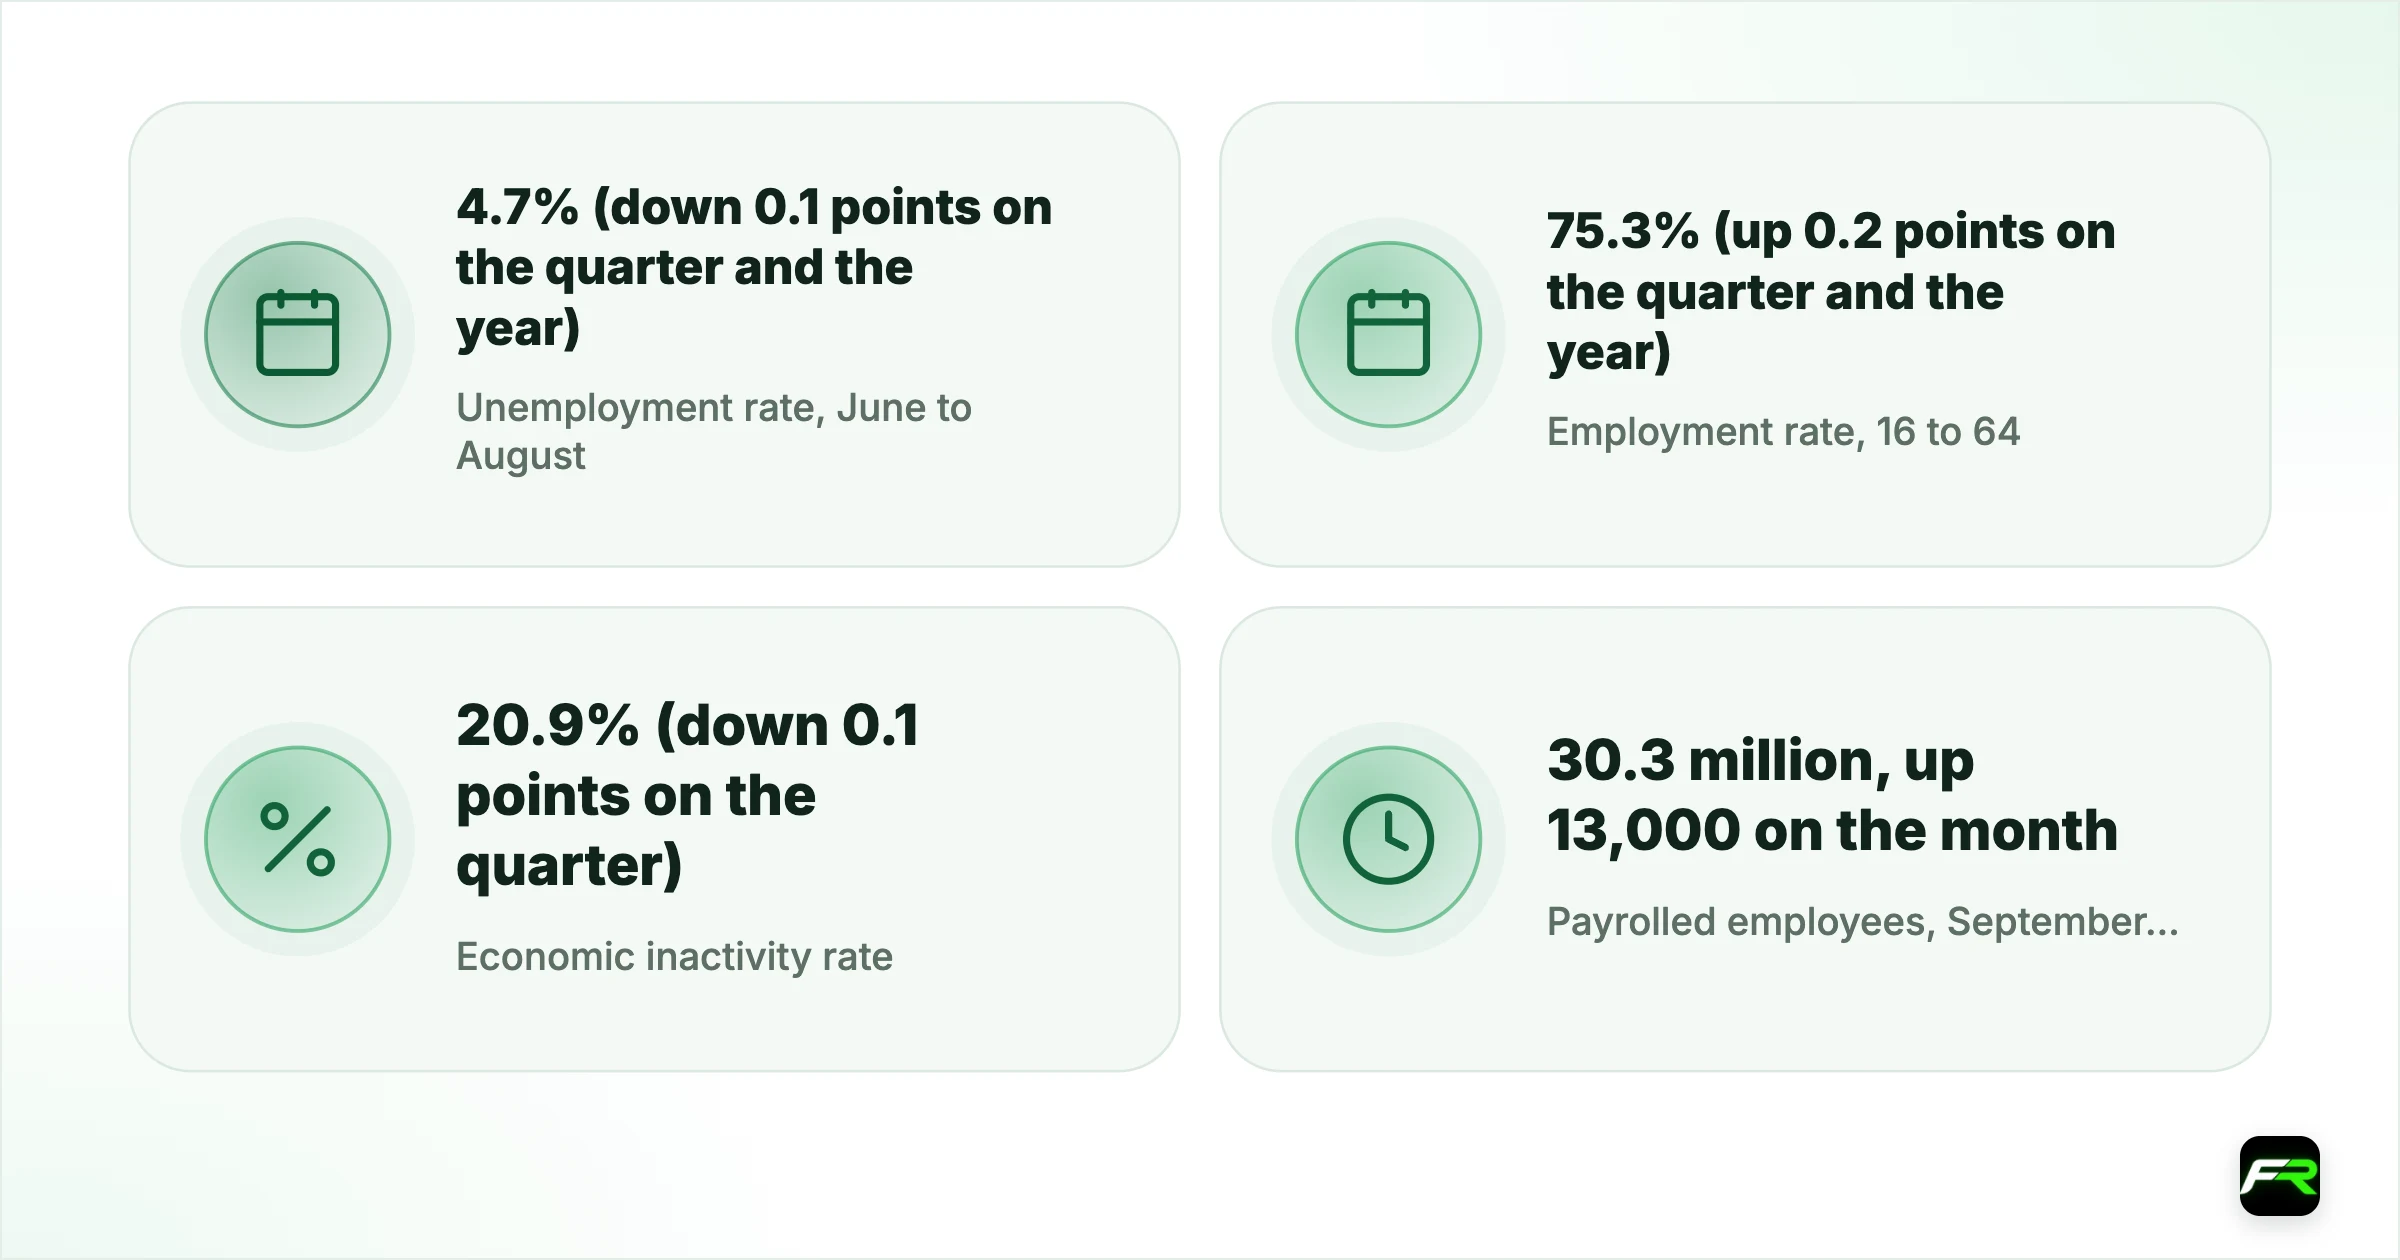
| Unemployment rate, June to August | 4.7% (down 0.1 points on the quarter and the year) |
|---|---|
| Employment rate, 16 to 64 | 75.3% (up 0.2 points on the quarter and the year) |
| Economic inactivity rate | 20.9% (down 0.1 points on the quarter) |
| Payrolled employees, September flash | 30.3 million, up 13,000 on the month |
| Vacancies, July to September | 691,000, down 21,000 (2.9%) on the quarter |
| Regular pay growth, June to August | 3.7% a year |
| Total pay growth, June to August | 3.7% (previous period: 3.9%) |
| Claimant Count, September | 1.701 million, up on the month and the year |
What the ONS reported
Two sources feed the headline numbers. The Labour Force Survey, a household survey, gives the unemployment, employment and inactivity rates. Tax records from HM Revenue and Customs give a monthly count of people on company payrolls. This month the survey looked better than the payroll data, a gap the ONS has asked users to keep in mind.
Survey figures improved. Unemployment among people aged 16 and over dropped to 4.7%. Employment among 16 to 64 year olds rose 0.2 points to 75.3%, and economic inactivity, which counts people who are neither working nor looking for work, fell to 20.9%. Survey response levels are now close to their pre-pandemic level, according to the statisticians, though they still advise caution with short-term changes and recommend reading the survey alongside the other indicators.
Payroll data were flatter. The number of payrolled employees rose by just 1,000 between July and August, and fell by 111,000, or 0.4%, compared with August 2025. Last month's early estimate had shown a fall of 26,000 in August, so the revision turned a drop into a small gain. The first estimate for September showed a rise of 13,000 to 30.3 million, which the ONS described as provisional and likely to be revised. Over June to August, the period that matches the survey, payrolls were 37,000 lower than in the previous quarter.
The Claimant Count, which measures people claiming unemployment-related benefits, rose on both the month and the year to an estimated 1.701 million in September. According to the ONS, recent revisions to that count have tended to be downwards.
Fewer vacancies, and smaller firms hold back
Vacancies are where the cooling shows most clearly. At 691,000 in July to September, they were 2.9% lower than in the spring and 5.1% lower than a year earlier. Outside the pandemic years, the last time there were this few open jobs was July to September 2014, when there were 686,000.
The ONS said feedback from its vacancy survey suggests smaller firms may not be recruiting because of higher labour costs. That fits with a slow drift rather than a sudden shock: vacancies have fallen by 28,000 since January to March, and this quarter's 21,000 drop matched the fall seen at the start of the year.
For the Bank of England, falling vacancies matter because they usually lead pay growth lower with a lag. Fewer open roles give workers less bargaining power, which should, over time, ease the pressure on wages and on service-sector prices. That process is slow, so one quarter's fall is a signal, not proof.
Pay growth: steady wages, smaller bonuses
Regular pay, which leaves out bonuses, grew 3.7% from a year earlier in June to August. The ONS said this rate has been relatively stable over six three-month periods in a row, after a year of slowing growth. Total pay also grew 3.7%, down from 3.9% in the previous period. It was last lower in August to October 2020, when it was 2.8%.
The split between sectors is wide. Regular pay rose 6.3% in the public sector and 3.0% in the private sector, and the ONS warned that public sector figures are being pushed around by the timing of pay awards this year. For inflation, private sector pay is the better guide, and 3.0% is a modest pace by recent standards.
After adjusting for inflation, workers are only just ahead. Using CPIH, which includes owner occupiers' housing costs, real regular pay grew 0.6% and real total pay 0.7%. On the CPI measure, the figures were 0.8% and 0.9%. With CPI inflation at 3.1% in August, household budgets are barely growing in real terms, which helps explain why spending has been soft.
| Measure | June to August 2026 |
|---|---|
| Regular pay growth, whole economy | 3.7% |
| Total pay growth, whole economy | 3.7% |
| Regular pay growth, public sector | 6.3% |
| Regular pay growth, private sector | 3.0% |
| Real regular pay growth (CPIH) | 0.6% |
| Real total pay growth (CPIH) | 0.7% |
Source: Office for National Statistics, Labour market overview, UK: October 2026. Rates are annual growth in average weekly earnings, three months on the same period a year earlier.
What it means for the pound and the Bank of England
The Bank of England held Bank Rate at 3.75% on 17 September, with six members voting to hold and three wanting a change. Its next decision is on 5 November. Tuesday's figures give each side something. A lower jobless rate and steady regular pay argue against any rush to cut, while falling vacancies, weak payroll growth and slowing total pay support the view that the jobs market is loosening.
Markets seemed to read the report as slightly positive for sterling. The early gain was modest, about 30 pips in GBP/USD, and the bigger move came later in the day, when the dollar fell against most currencies during US hours. By 18:00 UTC the pound had broken above Friday's high of 1.3371 and was testing the area just below 1.3420, where its 50-day average sits on our daily candles.
Wednesday brings the bigger test. The ONS publishes September consumer prices at 07:00 UK time, 06:00 UTC. In August, CPI inflation was 3.1%, core inflation 2.6% and services inflation 3.4%. A rise in services prices would sit awkwardly with steady pay and could push the pound higher, while a soft reading would put the focus back on the weaker parts of today's jobs report. Retail sales for September follow on Friday.
What traders can take from it
A jobs report with mixed signals is easy to over-trade. These points help keep it in proportion.
- Read the unemployment rate together with payrolls. The survey and tax data told different stories this month, and the ONS itself advises using both.
- Watch private sector pay more than the headline. At 3.0%, it is the cleaner guide to inflation pressure from wages.
- Treat the September payroll figure as a first draft. Last month's August estimate moved from a fall of 26,000 to a rise of 1,000.
- Keep size small into Wednesday's CPI. Two UK releases on consecutive mornings can reverse each other, and spreads widen at 06:00 UTC.
- Check where GBP/USD sits against 1.3310, the old range top, and the 1.3410 to 1.3420 zone. Those are the levels our daily analysis is watching.
Say you buy GBP/USD at 1.3370 on a pullback after the jobs report, with a stop at 1.3335, 35 pips below. A mini lot of 10,000 units is worth about $1 a pip, so the stop risks about $35 per mini lot. On a $5,000 account with a 1% limit of $50, one mini lot fits. If you plan to hold through Wednesday's CPI, consider halving the size, because the first minute after the release can jump straight through a 35-pip stop.
For today's levels, see our GBP/USD analysis. Release times for the rest of the week are on the economic calendar, and our week-ahead story sets out each UK release. Size each trade with the position size calculator.
UK data releases can move sterling sharply in the first minutes, and spreads often widen at 07:00 UK time. Leverage magnifies losses as well as gains, so trade only with money you can afford to lose.
All labour market figures are from the Office for National Statistics release of 20 October 2026. The previous unemployment rate and August payroll estimate are from the ONS bulletin published in September. Bank Rate and meeting dates are from the Bank of England. Currency levels are market data built from hourly bars to about 18:00 UTC on 20 October and differ slightly between providers. Comments on the pound are FX Recap's own reading. This is news, not investment advice.
Frequently asked
What is the UK unemployment rate in October 2026?
The latest figure, published by the ONS on 20 October 2026, shows UK unemployment at 4.7% for June to August 2026. That is 0.1 percentage points lower than the previous quarter and a year earlier.
How fast are UK wages growing?
Regular pay, excluding bonuses, grew 3.7% a year in June to August 2026, and total pay also grew 3.7%. Private sector regular pay rose 3.0% and public sector pay 6.3%. After CPI inflation, real regular pay grew 0.8%.
How many job vacancies are there in the UK?
The ONS estimated 691,000 vacancies in July to September 2026, down 21,000 on the quarter and 37,000 on the year. Outside the pandemic, vacancies were last this low in 2014.
When is the next UK labour market release?
The ONS publishes the next labour market overview on 17 November 2026. Before that, September CPI is due on 21 October and the Bank of England announces its rate decision on 5 November.
Sources: Office for National Statistics: Labour market overview, UK: October 2026 · Office for National Statistics: Consumer price inflation, UK: August 2026 · Bank of England: Bank Rate · Office for National Statistics: release calendar
The team behind this guide
Researched, checked and approved by five forex specialists
Every guide is written, fact-checked and edited before it goes live, and updated when the facts change. Spotted an error? Tell us.