 IC Markets





























Supply and Demand Trading Strategy for Forex
Supply and demand trading works by spotting the areas where price took off with real force, since those spots tend to react again when price comes back. Demand is the zone where buyers overwhelmed sellers and drove price up; supply is where sellers took control and pushed it down. The plan is to wait for price to return to one of these zones, then enter in the direction of that original move. It’s a reliable framework once you get an eye for it, though not every zone holds, so lean on extra confirmation before committing.
 WriterAbir KhanWriterWrites the guides · checks every figure against primary sources View profileAbout Abir →
 Market analysisTanbir Habib RiyadForex & Crypto AnalystForex and crypto analyst · technical and fundamental analysis View profileAbout Tanbir →
 Fact-checking & riskJannatul FerdaushFact-Checker & Risk AnalystFact-checks every figure · risk analysis · Applied Statistics, University of Dhaka View profileAbout Jannatul →
 Trading reviewJowel RanaCo-Founder & Forex TraderCo-founder · forex trader · reviews guides from a trader's view View profileAbout Jowel →
 Final approvalRanjan NiskrityFounder, Owner & Forex TraderFounder and owner · forex trader · signs off every guide View profileAbout Ranjan →
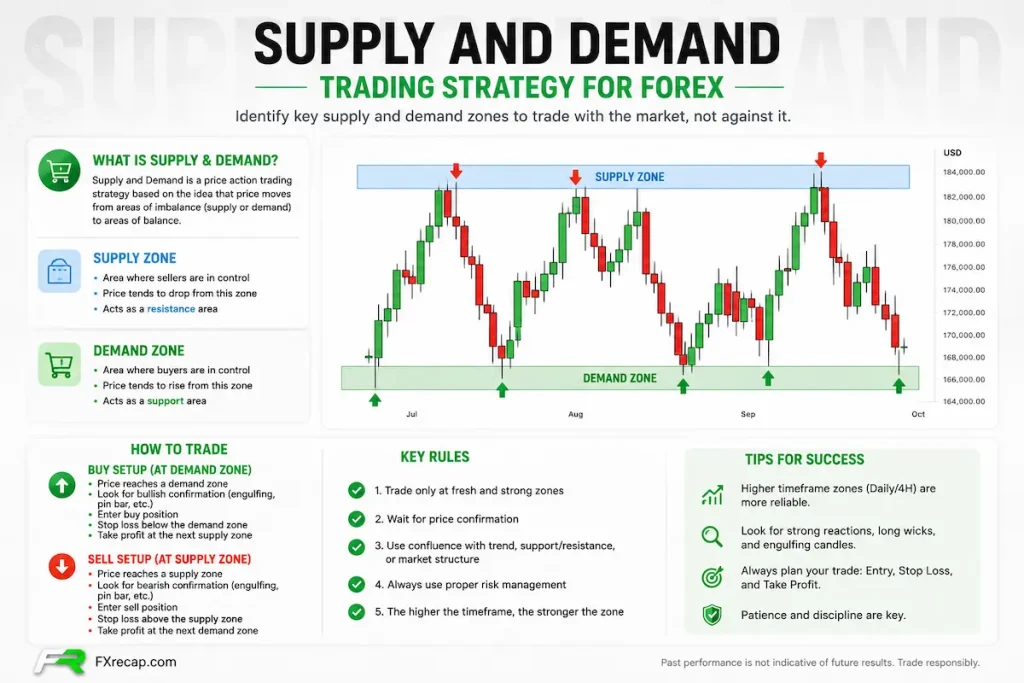
Supply and demand trading means marking the specific price zones where a sharp, fast move began, a tight consolidation followed by a strong breakout, then treating those zones as areas where price is likely to react again if it returns. A demand zone sits below current price and marks where buyers previously overwhelmed sellers. A supply zone sits above current price and marks where sellers previously overwhelmed buyers.
The strategy itself is simple to describe: mark the zone where a strong move originated, wait for price to pull back into it, then look for a rejection to enter in the direction of the original move.
What a Supply or Demand Zone Is
A supply or demand zone isn’t a random rectangle drawn around any pause in price. It marks an area of imbalance, a spot where one side of the market, buyers or sellers, became strong enough to push price away sharply, leaving behind orders that likely didn’t get fully filled.
The zone itself is the base, the tight consolidation right before the sharp move, not the entire move that followed. A common mistake is marking the whole rally or drop as the zone; the zone is specifically the pause that preceded it.
The Four Zone Patterns
| Pattern | Sequence | Zone Type |
| Drop-Base-Rally (DBR) | Sharp drop, tight base, sharp rally | Demand zone (reversal) |
| Rally-Base-Drop (RBD) | Sharp rally, tight base, sharp drop | Supply zone (reversal) |
| Rally-Base-Rally (RBR) | Rally, tight base, another rally | Demand zone (continuation) |
| Drop-Base-Drop (DBD) | Drop, tight base, another drop | Supply zone (continuation) |
Fresh vs Tested Zones
A fresh zone is one price hasn’t returned to since it formed. It’s generally treated as the strongest kind, since the unfilled orders that originally caused the move are more likely to still be sitting there. A tested zone has already absorbed one or more visits from price, and each visit is thought to use up some of those resting orders, weakening the zone’s ability to produce another strong reaction.
There’s no way to know exactly how many orders remain at a given zone. This is a matter of reading probability, not certainty, and treating freshness as one input among several rather than an absolute rule keeps expectations realistic.
What Makes a Zone Strong
• Speed of departure: price should leave the base quickly, in a small number of large candles, rather than drifting away slowly over many candles.
• Distance covered: a meaningful move away from the zone, say several dozen pips on a major pair, carries more weight than a small, limp breakout.
• A clean, tight base: two or three small candles clustered together, not a wide, sprawling consolidation that’s hard to define with clear boundaries.
• Location relative to the higher timeframe trend: a demand zone that lines up with a broader uptrend carries more weight than one sitting against it.
• Freshness: whether price has returned to test the zone since it formed.
How to Draw a Zone
Mark the base, the small cluster of candles right before the strong move, not the move itself. The zone’s far boundary sits at the extreme wick of the base candles. The near boundary, the edge closest to where price is likely to return from, is commonly drawn at either the open of the first large breakout candle or the body range of the base candles, depending on which method a trader prefers; the body-based method produces a tighter, more precise zone.
Keeping the zone tight matters. A demand zone stretched across a hundred pips isn’t a useful zone to trade. It’s too wide to give a meaningful entry or a defensible stop.
A Worked Example
Picture GBP/JPY dropping from 191.20 to 189.80, pausing for three small candles between 189.75 and 189.95, then rallying sharply back to 191.50. That three-candle base between 189.75 and 189.95 is the demand zone, the drop-base-rally pattern in action.
If price later pulls back down into that 189.75 to 189.95 zone and shows a clear rejection, a strong bullish candle closing back above the zone, that’s the signal a supply-and-demand trader would treat as a long entry, with a stop placed just below 189.75, the far edge of the zone.
Supply and Demand vs Order Blocks
Supply and demand zones and SMC order blocks describe closely related ideas from different trading traditions. Both mark a specific area where a strong, fast move originated, and both assume unfilled institutional orders sitting there are likely to cause a reaction if price returns.
The practical difference is mostly in definition and boundaries. An order block is defined from a single candle, the last opposing one before the impulsive move. A supply or demand zone is typically defined from a small base of several candles rather than one specific candle, and tends to be drawn slightly wider as a result. Traders coming from a classical technical analysis background tend to use supply and demand terminology; traders coming from SMC and ICT material tend to use order block terminology for a similar concept.
Supply and Demand Trading Strategy Step by Step
1. Set higher timeframe bias first, uptrend, downtrend, or range, since zones that align with that bias tend to perform better than zones traded against it.
2. Scan for a clean base on the four-hour or daily chart, ignoring rallies or drops that had no clear pause before them.
3. Mark the zone tightly around the base candles, not the full move that followed.
4. Note whether the zone is fresh or has already been tested, and weigh that alongside the other strength factors.
5. Wait for price to return to the zone and show a clear rejection before entering, rather than entering the moment price touches the boundary.
6. Place the stop just beyond the zone’s far edge, and target the next opposing zone or structural level.
People’s Most Asked
What is a supply and demand zone in forex?
A specific price area where a sharp, fast move originated after a small consolidation, marking where buying or selling pressure was strong enough to leave unfilled orders behind that may cause a reaction if price returns.
What is the difference between supply/demand zones and support/resistance?
Support and resistance is typically drawn from multiple touches at roughly the same horizontal level. A supply or demand zone is defined by the specific base that preceded a strong move, whether or not price ever touched that exact level before, and tends to explain why the level matters rather than just marking that it does.
Are supply and demand zones the same as order blocks?
They describe closely related ideas. An order block is defined from a single candle. A supply or demand zone is typically defined from a small multi-candle base, making the zones themselves usually a bit wider.
What makes a fresh zone stronger than a tested one?
A fresh zone hasn’t absorbed any reactions since it formed, so the unfilled orders that caused the original move are more likely to still be resting there. Each time price returns to a zone, some of those orders are thought to get used up, weakening the zone’s reliability.
What timeframe works best for supply and demand trading?
Many traders mark zones on the four-hour or daily chart for cleaner, more reliable bases, since very low timeframes tend to produce too many small, noisy zones to filter through effectively.
How do you know a supply and demand zone has been invalidated?
A decisive candle close through the zone, rather than a brief wick into it, is generally treated as invalidation. Once that happens, most traders remove the zone from consideration rather than continuing to watch it.
Final Word
Supply and demand trading gives you a specific, chart-based reason for why a level might matter, rather than a level marked just because price touched it once before. The zone itself doesn’t guarantee a reaction. What separates a workable setup from a guess is the quality of the base, how fresh the zone is, and whether a real rejection shows up once price actually returns, not just the presence of a rectangle on the chart.
The team behind this guide
Researched, checked and approved by five forex specialists
Every guide is written, fact-checked and edited before it goes live, and updated when the facts change. Spotted an error? Tell us.
Related Articles
 Education
17 min read
Education
17 min read

 Education
7 min read
Education
7 min read
 Education
23 min read
Education
23 min read
 Education
8 min read
Education
8 min read
 Education
9 min read
Education
9 min read
 Education
7 min read
Education
7 min read