IC Markets

 3:09
 2:39
 2:10
 2:18
 3:43
 8:42





































Euro Area Growth Slows to 0.4% in the Third Quarter as France Shrinks and Italy Stalls
Germany managed only 0.2% and joblessness held at 6.5%, leaving the ECB weighing a possible December rise against a softer economy.
 WriterAbir KhanWriterWrites the guides · checks every figure against primary sources View profileAbout Abir →

 Market analysisTanbir Habib RiyadForex & Crypto AnalystForex and crypto analyst · technical and fundamental analysis View profileAbout Tanbir →

 Fact-checking & riskJannatul FerdaushFact-Checker & Risk AnalystFact-checks every figure · risk analysis · Applied Statistics, University of Dhaka View profileAbout Jannatul →

 Trading reviewJowel RanaCo-Founder & Forex TraderCo-founder · forex trader · reviews guides from a trader's view View profileAbout Jowel →

 Final approvalRanjan NiskrityFounder, Owner & Forex TraderFounder and owner · forex trader · signs off every guide View profileAbout Ranjan →

The euro area economy grew 0.4% in the third quarter of 2026, down from 0.6% in the second, according to Eurostat's preliminary flash estimate published on Friday 30 October. The wider EU expanded 0.5%. Compared with the same quarter a year earlier, euro area output was up 1.3%, a touch better than the 1.2% annual pace of the spring.
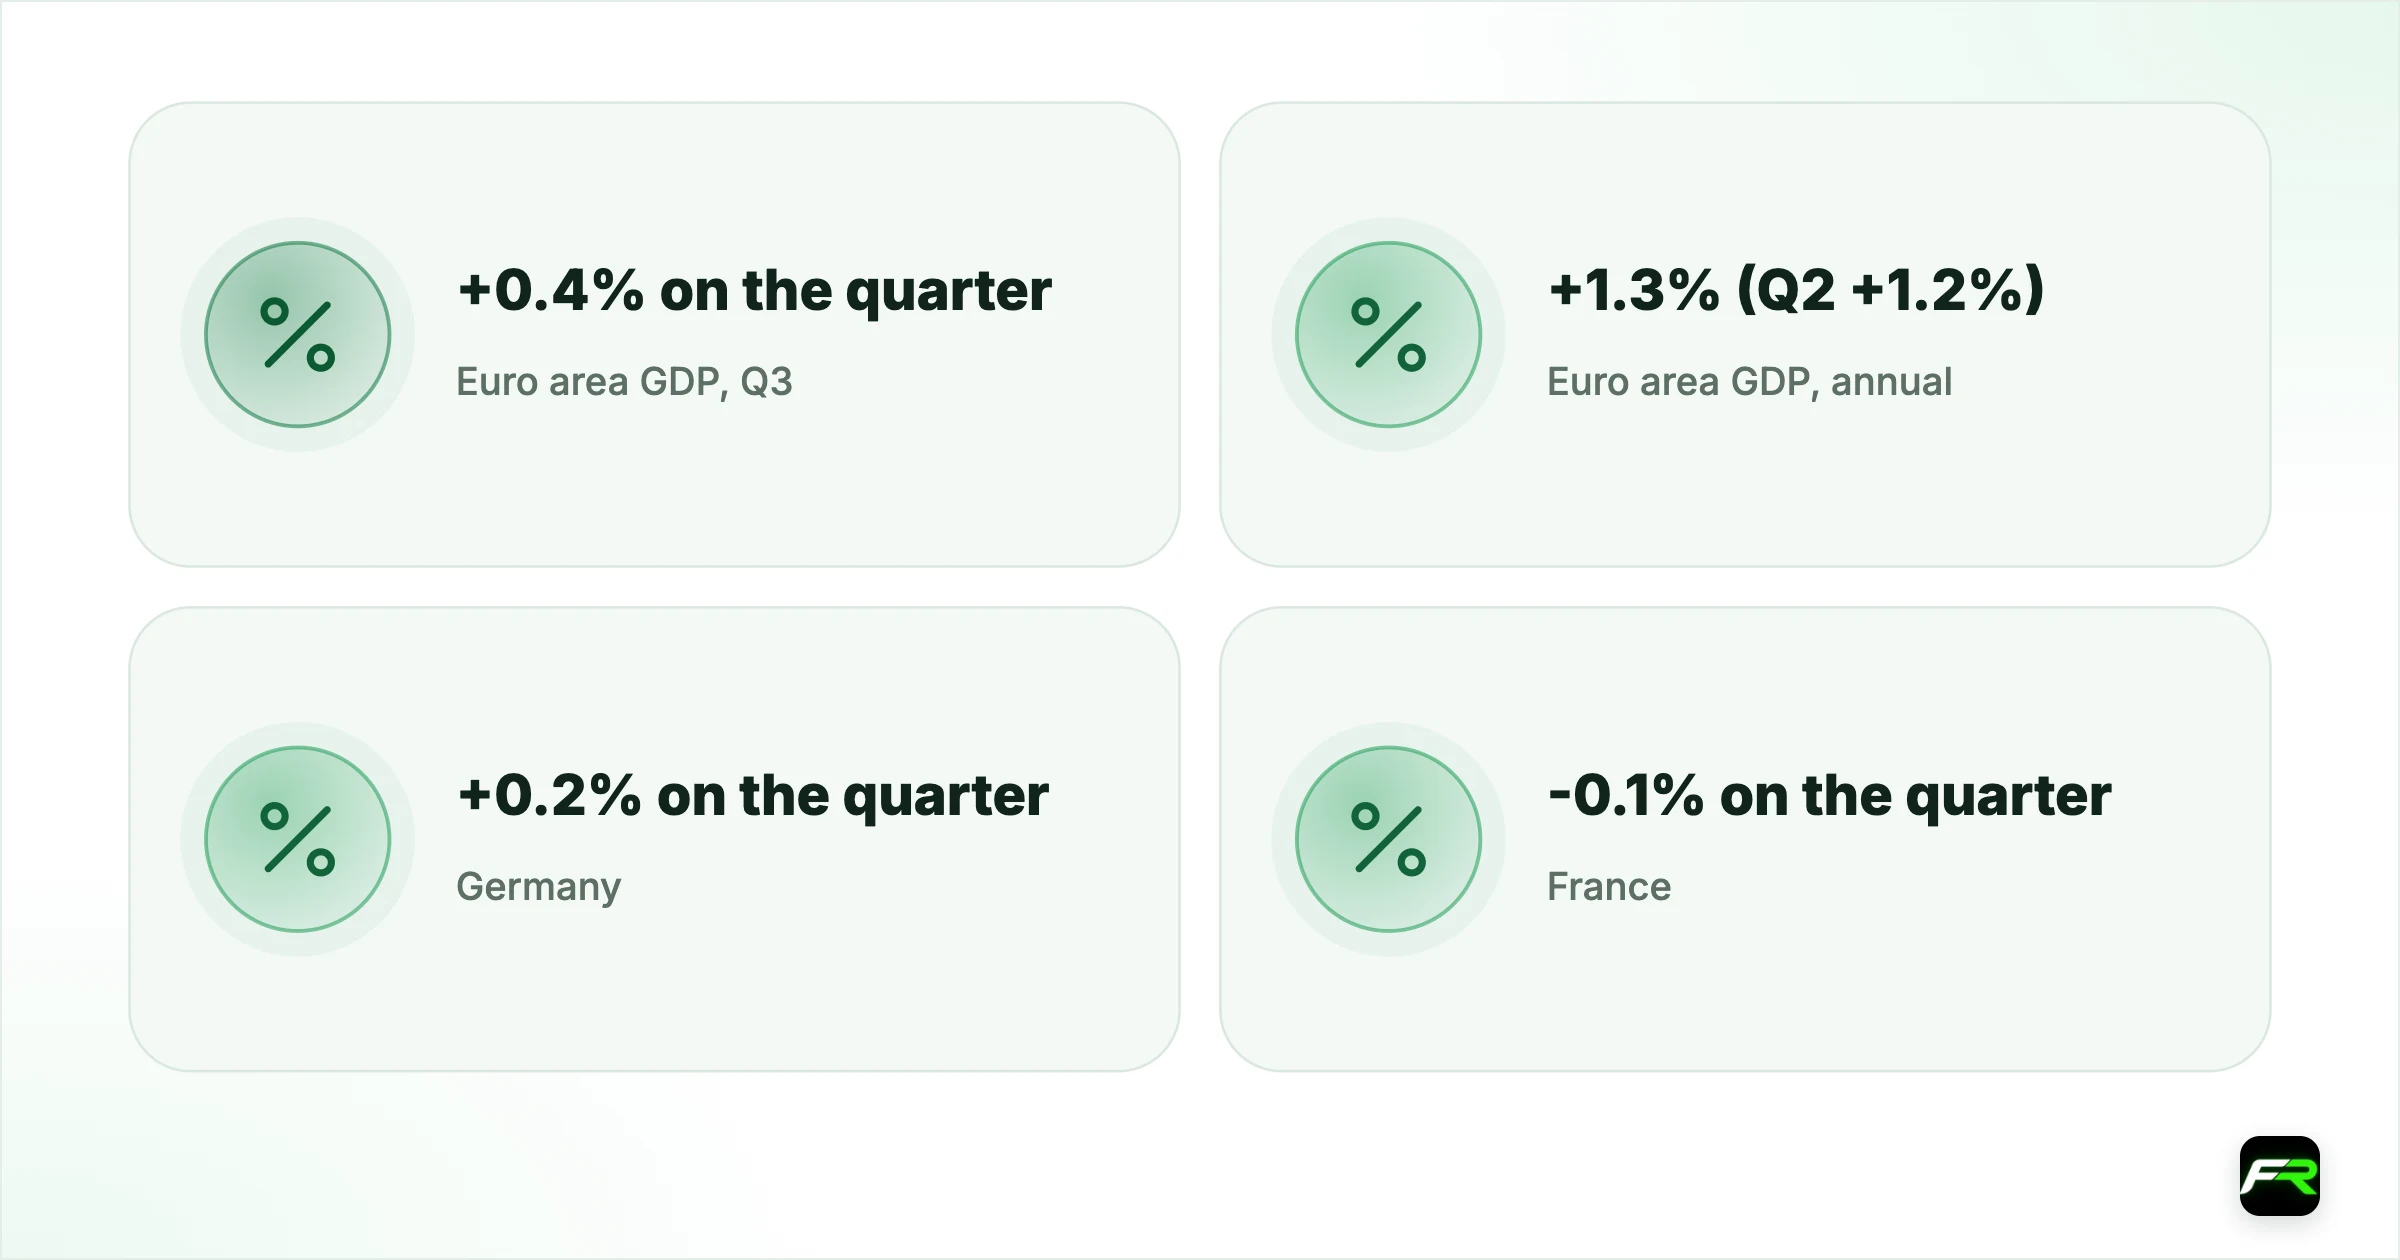
The average hides a wide gap between members. France shrank 0.1%, Italy did not grow at all and Germany added just 0.2%, while Spain and the Netherlands each managed 0.6%. Ireland reported a 5.5% jump, which Eurostat flags as experimental. Set that volatile Irish figure aside and the largest economies look weaker than the headline.
A separate Eurostat release the same day put the September unemployment rate at 6.5%, unchanged from August but up from 6.3% a year earlier. Both figures reach the European Central Bank at an awkward moment: on 29 October it held its deposit rate at 2.50% after openly debating a rise, with inflation at 3.8%.
| Euro area GDP, Q3 | +0.4% on the quarter (Q2 +0.6%) |
|---|---|
| Euro area GDP, annual | +1.3% (Q2 +1.2%) |
| Germany | +0.2% on the quarter |
| France | -0.1% on the quarter |
| Italy | 0.0% on the quarter |
| Spain | +0.6% on the quarter |
| Unemployment, September | 6.5% (a year ago 6.3%) |
| Next GDP estimate | 13 November 2026 |
Where growth came from and where it did not
The three largest economies all sit at or below the euro area average. Germany's 0.2% followed 0.3% in the second quarter, and its annual rate stands at 1.2%. Italy slipped from 0.2% to flat, with annual growth of 0.8%. France has now gone three quarters without meaningful growth: -0.2% in the first, 0.0% in the second and -0.1% in the third. Its annual change is -0.1%, and it is the only reporting country below zero on that measure.
Spain remains the steady performer, with 0.6% on the quarter and 2.7% over the year. The Netherlands matched the quarterly figure, with 2.1% annual growth. Lithuania had the steepest fall, 1.0%, and Eurostat counted fourteen countries with positive annual growth and one with a decline.
Ireland needs care. Its GDP swung from -7.8% in the first quarter to +10.2% in the second and +5.5% in the third. Eurostat labels the flash figure an experimental output built mostly from production data, and warns that it will be revised. Irish GDP has moved by amounts far larger than the rest of the bloc in each of the past three quarters, so you should not read its third-quarter jump as a sign of general strength in Europe.
Unemployment is stable on the rate, rising on the headcount
A steady 6.5% looks calm, but the number of people out of work moved up. Eurostat estimates 11.555 million were unemployed in the euro area in September, an increase of 122,000 on the month and 420,000 on the year. France's rate jumped to 8.5% from 8.3%. Italy edged up to 6.3% from 6.2% and Spain to 10.3% from 10.2%, while Germany held at 4.1%, though that compares with 3.8% a year before.
Younger workers are feeling it first. Youth unemployment in the euro area rose to 15.4% from 15.1% in a single month. One month of data can be noisy, and Eurostat revises these series, but the direction since last September is clear in the larger economies. The ECB's statement on 29 October cited a rate of 6.4% for August, and Eurostat's latest table now shows 6.5% for that month.
How much weight a flash estimate can bear
This is the earliest GDP reading Eurostat publishes, about 30 days after the quarter ends. It rests on data from 19 member states that together make up 96% of euro area output, and Eurostat states plainly that the sources are incomplete and open to revision. A second estimate arrives on 13 November, and it adds employment figures a little later in the same round of releases.
For a trader, that means the first number is useful for direction and less so for precision. A change of 0.1 percentage points in a later round would be ordinary, and it could turn France's small decline into a flat reading or do the reverse. What is less likely to change quickly is the pattern across countries: a stronger south and a slow core. Treat any single decimal with some caution, and do not build a large position on it.
Why this complicates the ECB's December decision
The ECB said on 29 October that energy costs were “posing upside risks to the inflation outlook and downside risks to the growth outlook.” Friday's data fits the second half of that sentence better than the first. A central bank worried about inflation can still raise rates into slower growth, but each soft release makes the argument harder to win, especially as financing conditions have already tightened by themselves. President Christine Lagarde put the rise in average 10-year government yields at around 35 basis points since the September projections' cut-off date.
Still, the numbers are not a recession signal. Growth of 0.4% in a quarter is respectable by recent euro area standards: the table shows 0.2% in the fourth quarter of 2025 and zero in the first quarter of this year. Lagarde told reporters that “the direction of travel is quite clear” unless the data changes, so one GDP estimate is unlikely to settle things. Flash inflation for October, due on Wednesday 4 November, carries more weight for December. Our week-ahead guide lists that release and the others around it.
The gap with the United States
Be careful with the comparison people will make. The US Bureau of Economic Analysis reported 3.4% growth for the third quarter, but that is an annual rate. Eurostat's 0.4% is a plain quarterly change. Compounded over a year, 0.4% comes to about 1.6%, so the honest comparison is roughly 3.4% against 1.6%, still a clear gap but not the one the raw figures suggest. Our calculation is an illustration only, since the two agencies' methods differ.
That difference helps explain the euro's path this year. The ECB reference rate for EUR/USD was 1.1130 on 29 October, the 2026 low, and recovered to 1.1172 on 30 October. Friday's fixing came after the morning's Eurostat data, but a single day's move does not tell you the release caused it, since Treasury yields fell that day too. The 2-year par yield closed at 4.56%, down from 4.61% on Thursday.
What it means for traders
- Separate the two ECB stories. Inflation argues for a rise while growth argues for patience, so expect EUR/USD to react most to whichever one surprises.
- Watch the 2026 low. The 1.1130 reference rate from 29 October is the obvious marker, though the fixing is a daily snapshot and the live market may have traded below it.
- Look past the euro area headline. Weakness in France and Germany matters for euro crosses and for regional bond spreads more than Ireland's swing does.
- Mark the revisions. Eurostat's next GDP estimate on 13 November can change these figures, and the October unemployment rate follows on 2 December.
Suppose you buy EUR/USD at 1.1172 and place your stop at 1.1120, just under the 2026 reference-rate low, which is 52 pips away. On a $2,000 account with a 1% risk limit you can lose $20, so your size is about 3,850 units, where one pip is worth about $0.38. Flash inflation on 4 November could jump past that stop, so check the date first. Our <a href="/position-size-calculator">position size calculator</a> does the maths for any pair.
Daily levels for the pair are on our EUR/USD analysis page, and the ECB's own explanation is covered in our ECB decision report.
Macro data can move currencies sharply, and flash estimates are often revised. Leverage magnifies losses as well as gains, so trade only with money you can afford to lose.
GDP and unemployment figures come from Eurostat's releases of 30 October 2026. Quotes come from the ECB's published statement and press conference of 29 October. The 3.4% US figure is from the Bureau of Economic Analysis. Exchange rates are ECB euro reference rates, and yields are US Treasury par yields. The annualised 1.6% is our own calculation. This is news, not investment advice.
Cite this guide
FX Recap, "Euro Area Growth Slows to 0.4% in the Third Quarter as France Shrinks and Italy Stalls", updated 31 October 2026, https://fxrecap.com/forex-news/top-stories/euro-area-gdp-0-4-percent-france-shrinks-q3-2026
Free to quote with a link. Journalists: data and comment in our press room.
Frequently asked
How much did the euro area grow in the third quarter of 2026?
Eurostat's preliminary flash estimate shows GDP up 0.4% on the previous quarter and 1.3% on a year earlier. Growth in the second quarter was 0.6%. The next estimate is due on 13 November 2026.
Did France's economy shrink in the third quarter?
Yes. Eurostat's table shows France at -0.1% on the quarter and -0.1% on the year. Italy was flat, Germany grew 0.2% and Spain grew 0.6%.
What is the euro area unemployment rate?
It was 6.5% in September 2026, unchanged from August and up from 6.3% a year earlier. About 11.555 million people were unemployed, according to Eurostat.
Does this stop the ECB raising rates in December?
Not on its own. The ECB debated a rise in October with inflation at 3.8%. Softer growth makes the case harder, but flash inflation on 4 November and new projections on 17 December matter more.
Sources: Eurostat: GDP preliminary flash estimate, third quarter 2026 · Eurostat: euro area unemployment, September 2026 · ECB: monetary policy statement and press conference, 29 October 2026 · ECB: euro foreign exchange reference rates · US Bureau of Economic Analysis: GDP, third quarter 2026 advance estimate · US Treasury: daily par yield curve rates
The team behind this guide
Researched, checked and approved by five forex specialists
Every guide is written, fact-checked and edited before it goes live, and updated when the facts change. Spotted an error? Tell us.