IC Markets





























How Many Pips Does Gold Move per Day? How to Measure XAUUSD's Daily Range
Published figures for gold's daily range disagree because they use different pip definitions and periods. Here is how to measure it yourself with ATR, what a recent day looked like, and how to use the range for stops and targets.
 WriterAbir KhanWriterWrites the guides · checks every figure against primary sources View profileAbout Abir →
 Market analysisTanbir Habib RiyadForex & Crypto AnalystForex and crypto analyst · technical and fundamental analysis View profileAbout Tanbir →
 Fact-checking & riskJannatul FerdaushFact-Checker & Risk AnalystFact-checks every figure · risk analysis · Applied Statistics, University of Dhaka View profileAbout Jannatul →
 Trading reviewJowel RanaCo-Founder & Forex TraderCo-founder · forex trader · reviews guides from a trader's view View profileAbout Jowel →
 Final approvalRanjan NiskrityFounder, Owner & Forex TraderFounder and owner · forex trader · signs off every guide View profileAbout Ranjan →
Gold's daily movement is best measured in dollars, and in 2026, with gold above $4,000, moves of tens of dollars in a session are common. Expressed in pips the number changes with the definition: a $50 range is 500 pips if a pip is $0.10, 5,000 pips if a pip is $0.01, and 50 if a pip is $1. That is why figures quoted online range from 200 to over 2,000 pips for what may be similar days.
The reliable way to know gold's current range is to measure it on your own chart with the Average True Range indicator. This page shows how, gives a recent example from market reports, and explains how to use the range to set stops, targets and position sizes.
| Best unit | Dollars per ounce |
|---|---|
| Tool | Average True Range (ATR), daily chart, 14 periods |
| Recent example | About $4,140 to $4,200 on 1 October 2026 |
| Pip confusion | $0.01, $0.10 or $1 depending on who is speaking |
| Use it for | Stop distance, targets and position size |
Why published numbers disagree
Three things change the answer. The pip definition, as above. Then the period: gold's range in a calm year is far smaller than in a year of record highs. And the price level: a 1% move is $20 when gold is $2,000 and $42 when it is $4,200, so ranges in dollars grow as the price rises even if percentage moves stay similar. An article written in 2018 and one written in 2026 can both be right and still give very different figures.
Measure it yourself with ATR
- Open an XAUUSD daily chart.
- Add the Average True Range indicator from the indicator list, with the default 14 periods.
- Read the current value: that is the average daily range in dollars over the last 14 days.
- Repeat on a 4-hour or 1-hour chart for intraday ranges.
ATR measures the true range of each bar, including gaps from the previous close, and averages it. It does not show direction, only how far price typically travels. Rising ATR means the market is getting more volatile; falling ATR means it is calming down.
A recent day in numbers
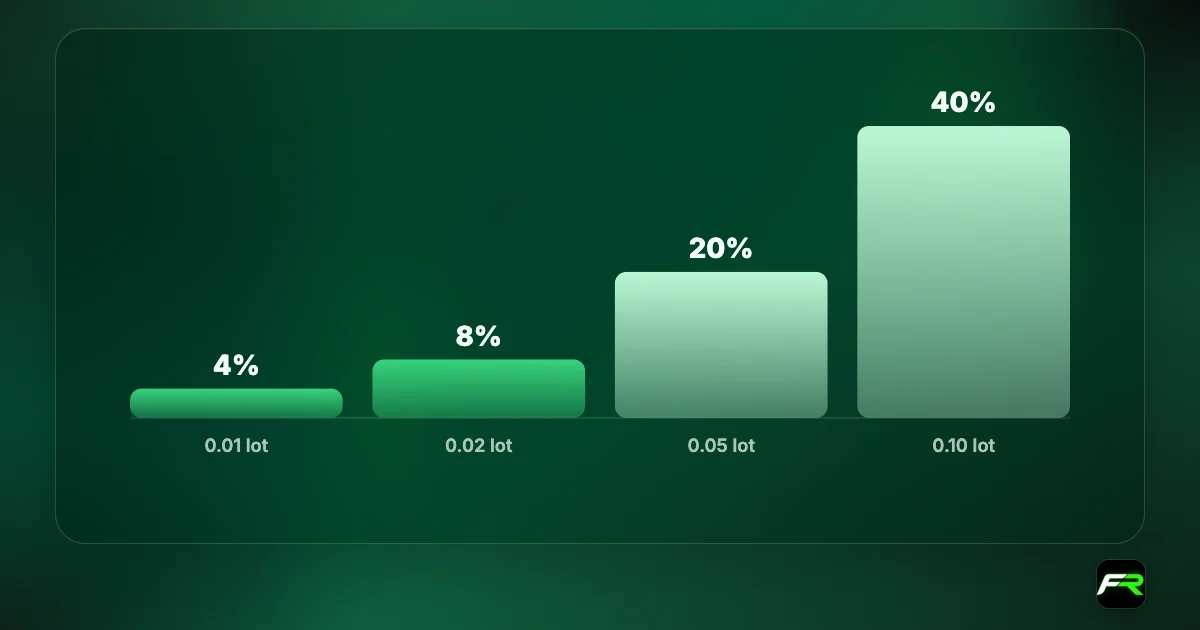
Market reports on 1 October 2026 described gold moving higher from lows around $4,140 to trade slightly below $4,200, a range of roughly $55 to $60 for the day. On 2 October, a weaker-than-expected US jobs report pushed it back above $4,200. A $60 day equals 600 pips in the $0.10 convention and is worth $6,000 on 1 lot or $60 on 0.01 lots.
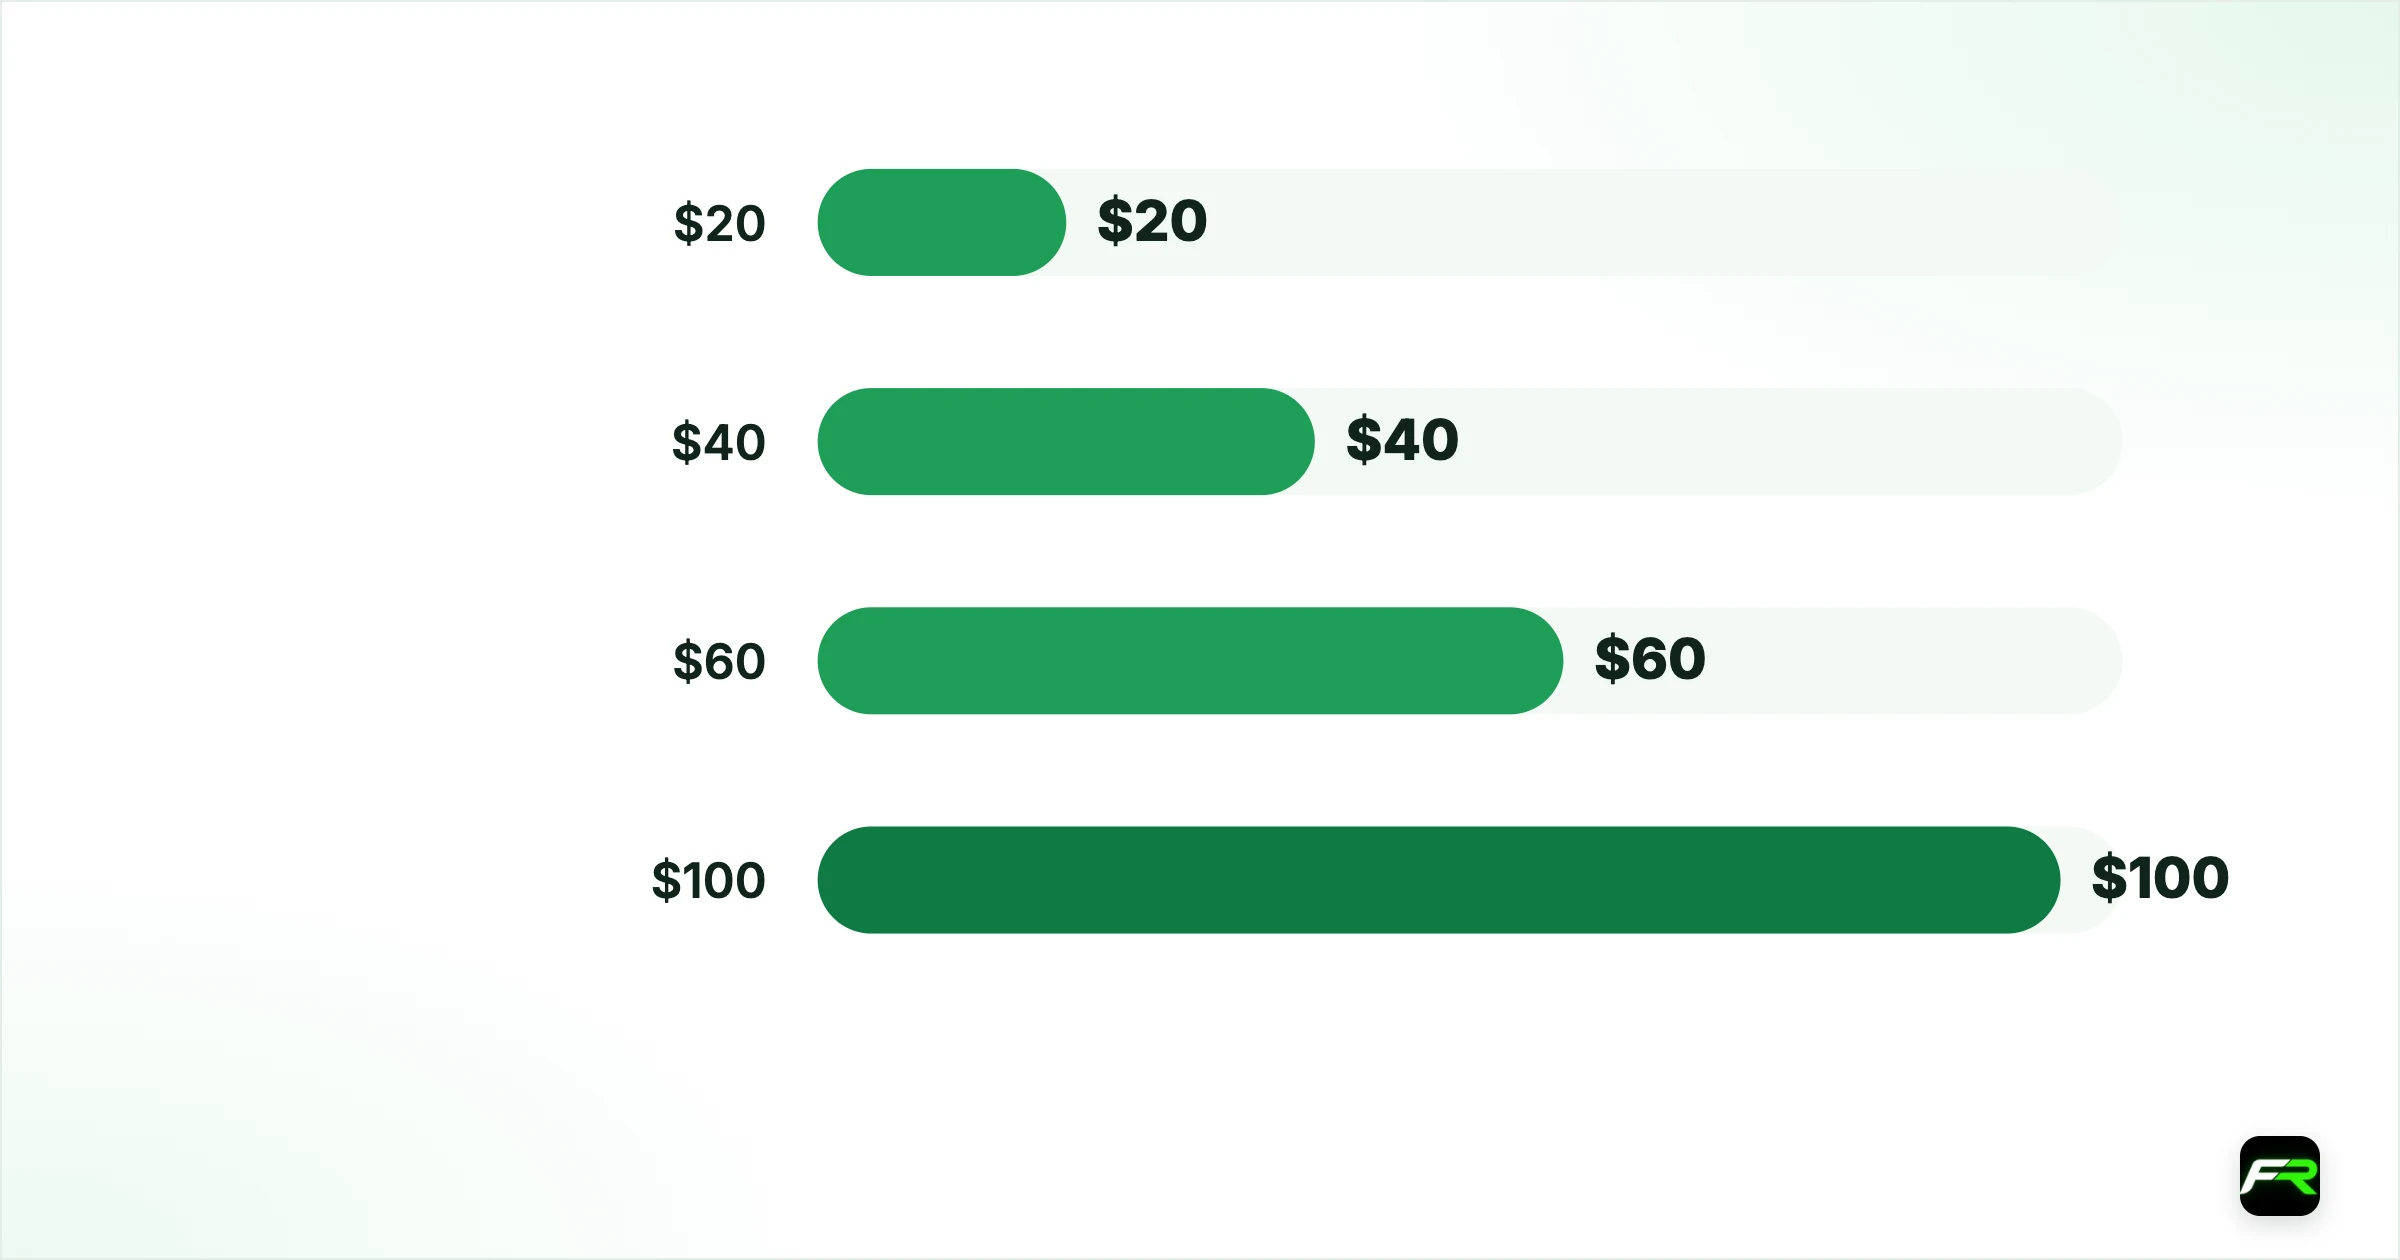
| Range in dollars | In $0.10 pips | On 0.01 lot | On 0.10 lot | On 1 lot |
|---|---|---|---|---|
| $20 | 200 | $20 | $200 | $2,000 |
| $40 | 400 | $40 | $400 | $4,000 |
| $60 | 600 | $60 | $600 | $6,000 |
| $100 | 1,000 | $100 | $1,000 | $10,000 |
When gold moves most
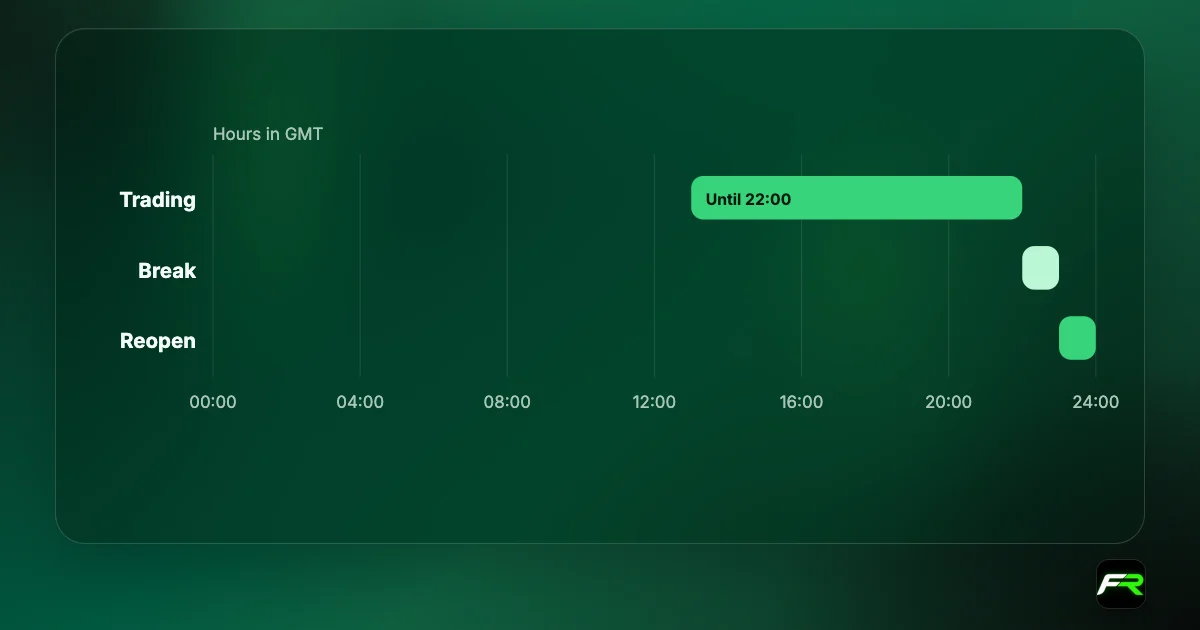
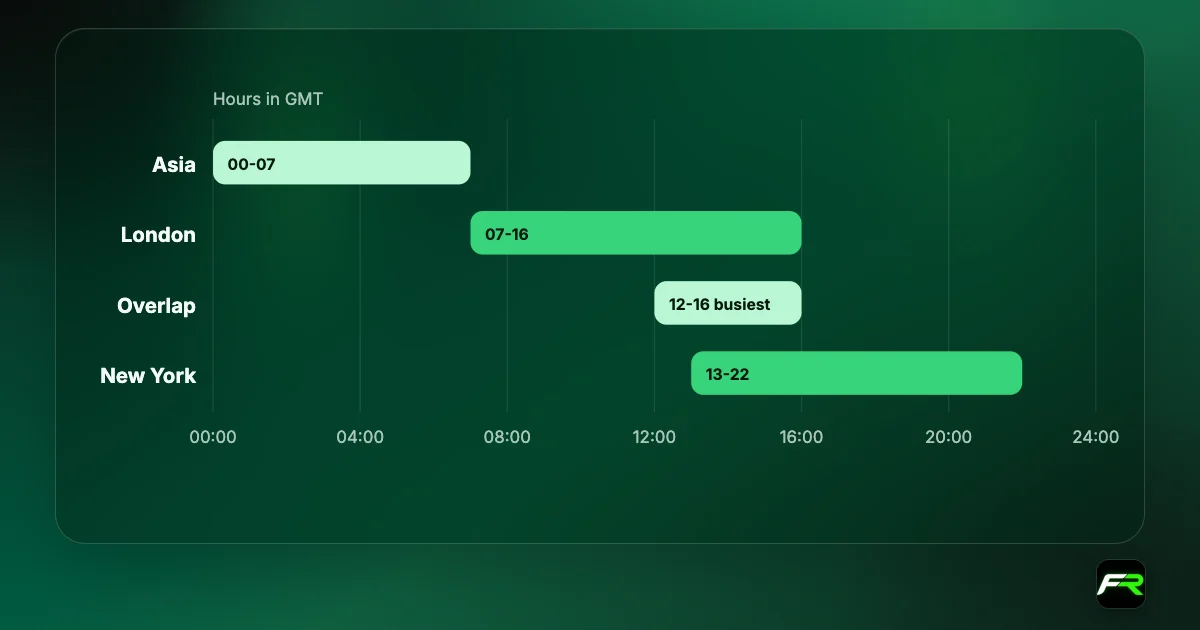
Gold tends to be busiest during the London session and the overlap with New York, roughly 12:00 to 16:00 GMT, and around major US data such as payrolls, inflation and Federal Reserve decisions. The Asian session is usually quieter, and the hour around the daily break near 17:00 New York time is thin. Our guide to gold trading hours lists the sessions in several time zones.
Using the range for stops
A stop well inside gold's normal hourly or daily movement will be hit by noise. Many traders set stops at a fraction or multiple of ATR on their trading timeframe, for example 1 to 1.5 times the 1-hour ATR for intraday trades, or 0.5 to 1 times the daily ATR for swing trades. Then they size the position so that stop equals their chosen risk.
A trader in Accra sees a 1-hour ATR of $8 on gold and places a stop $10 from entry, about 1.25 times ATR. Risking $25 on a $500 account, the position size is $25 ÷ $10 ÷ $100 = 0.025 lots, rounded down to 0.02. The trade risks $20, and the stop sits outside the typical hourly noise.
Using the range for targets
If gold's daily ATR is $50 and price has already moved $45 from the day's low, a target another $40 higher is ambitious for the same day. ATR helps set realistic targets and judge whether a move has room left. It does not predict, but it stops you expecting a quiet day's range to deliver a news day's move.
Weekly and monthly ranges
Swing traders care more about the weekly range than the daily one. Add ATR to a weekly chart for the average weekly movement; it is usually several times the daily figure. A stop sized for a day trade will be far too tight for a position you plan to hold for two weeks. Match the ATR timeframe to how long you expect to stay in the trade.
Position size scales with range
When ranges widen, the same stop in ATR terms is wider in dollars, so the lot size must shrink to keep risk constant. Traders who keep the same lot size as gold's range grows are quietly taking more risk each month. Re-check ATR weekly and adjust. The gold lot size calculator does the arithmetic.
Compared with currency pairs
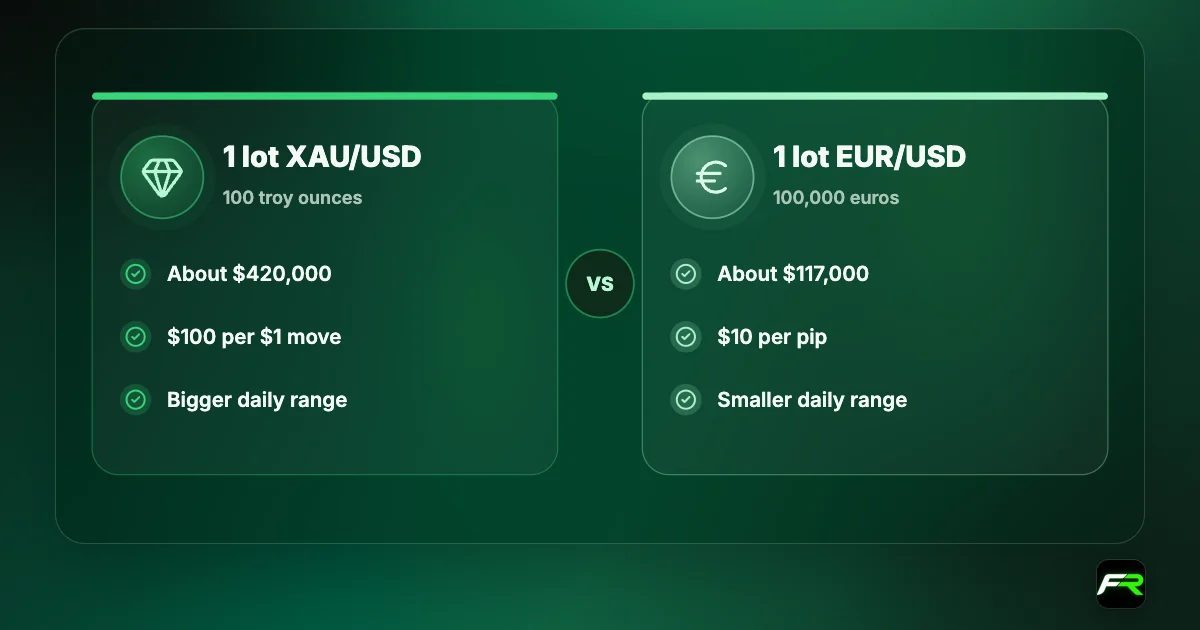
Gold's daily movement in percentage terms is usually larger than that of major pairs such as EUR/USD, and in money per lot it is far larger because of the 100-ounce contract. A 0.10-lot gold trade can move as much in dollars as a standard lot of EUR/USD on a busy day. That is why our gold trading guide recommends smaller sizes than on forex.
Add ATR to your gold chart template so the current range is always visible. It takes the guesswork out of stop placement.
Gold's range can double on news days. A position sized for a normal day can carry twice the risk on payrolls or a Fed decision.
Frequently asked
How many pips does gold move per day?
It depends on the pip definition and the period. In dollars, gold often moves tens of dollars a day at 2026 prices; a $60 range is 600 pips if a pip is $0.10. Measure the current range with a 14-period daily ATR.
What is the average daily range of XAUUSD?
The ATR indicator on a daily chart shows it in dollars over the last 14 days. That figure changes with volatility and price level, so a number from an old article may not match today's market.
When does gold move the most?
Usually during the London and New York overlap, roughly 12:00 to 16:00 GMT, and around major US data and Federal Reserve decisions. The Asian session and the hour around the daily break near 17:00 New York time are quieter.
How do I set a stop loss on gold?
Base it on gold's normal movement, for example 1 to 1.5 times the ATR on your trading timeframe, then size the position so that stop equals your chosen risk. Avoid stops well inside the typical hourly range.
Why do websites give different gold pip ranges?
They use different pip definitions ($0.01, $0.10 or $1), different years and different price levels. Converting to dollars per ounce makes the figures comparable.
Is gold more volatile than forex?
Usually yes in percentage terms, and much more in money per lot because of the 100-ounce contract. Smaller position sizes on gold help keep risk similar to your forex trades.
Official sources: CME Group: gold futures fact card
Related reading
The team behind this guide
Researched, checked and approved by five forex specialists
Every guide is written, fact-checked and edited before it goes live, and updated when the facts change. Spotted an error? Tell us.