IC Markets





































Risk-Reward Ratios: Why 1:2 Beats a High Win Rate
A trade log worked through to show why a 40% win rate at 1:2.5 makes money and an 80% win rate at 1:0.5 loses it. Win rate on its own tells you almost nothing.
 WriterAbir KhanWriterWrites the guides · checks every figure against primary sources View profileAbout Abir →
 Market analysisTanbir Habib RiyadForex & Crypto AnalystForex and crypto analyst · technical and fundamental analysis View profileAbout Tanbir →
 Fact-checking & riskJannatul FerdaushFact-Checker & Risk AnalystFact-checks every figure · risk analysis · Applied Statistics, University of Dhaka View profileAbout Jannatul →
 Trading reviewJowel RanaCo-Founder & Forex TraderCo-founder · forex trader · reviews guides from a trader's view View profileAbout Jowel →
 Final approvalRanjan NiskrityFounder, Owner & Forex TraderFounder and owner · forex trader · signs off every guide View profileAbout Ranjan →
Key takeaways
- Win rate on its own tells you almost nothing; expectancy = (win rate x average win) - (loss rate x average loss).
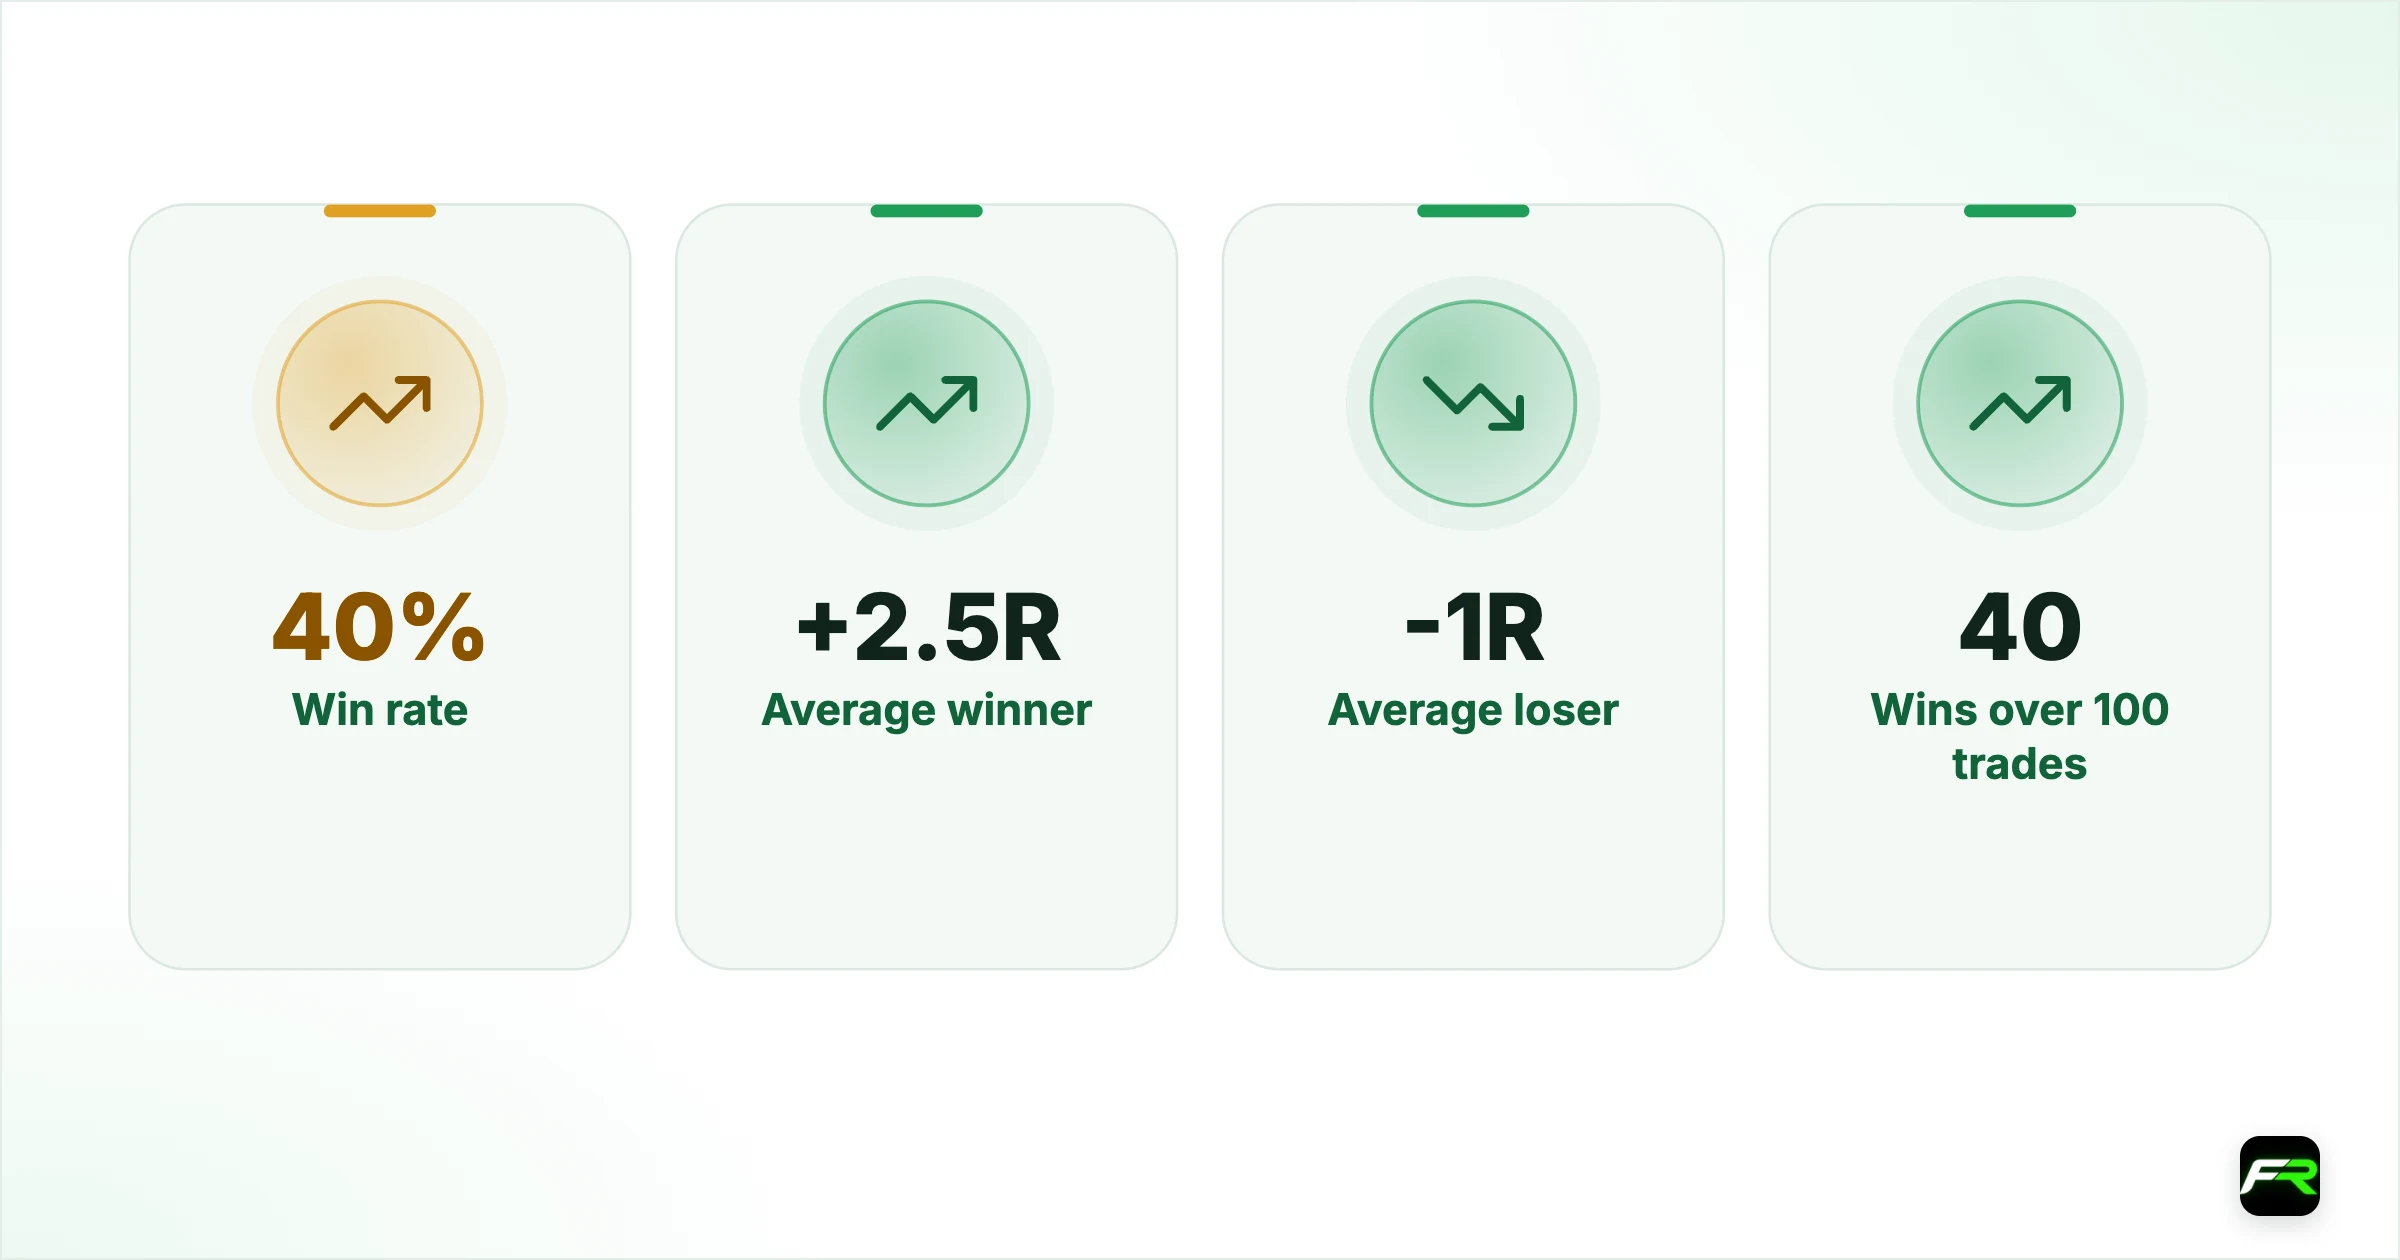
- A 40% win rate with 2.5R winners made +40R over 100 trades, double an 80% win rate with 0.5R winners.
- High win-rate strategies tend to hide growing losers, as traders move stops to protect the record.
- A durable target: 40% to 55% win rate with winners 1.5 to 3 times the size of losers, logged in R.
Beginners obsess over win rate because it is the number that feels like being right. But win rate on its own is close to meaningless. A strategy that wins 80 per cent of the time can lose money, and a strategy that wins 40 per cent of the time can compound an account. What matters is win rate combined with the size of the average winner relative to the average loser. This guide works through the maths with a real-style trade log.
Two strategies, 100 trades each
| Strategy A | Strategy B | |
|---|---|---|
| Win rate | 40% | 80% |
| Average winner | +2.5R | +0.5R |
| Average loser | -1R | -1R |
| Wins over 100 trades | 40 | 80 |
| Losses over 100 trades | 60 | 20 |
| Total from wins | +100R | +40R |
| Total from losses | -60R | -20R |
| Net over 100 trades | +40R | +20R |
Strategy A, wrong 60 per cent of the time, ends up ahead by 40R. Strategy B, right 80 per cent of the time, ends up ahead by 20R, half as much. And that is a favourable version of B. If B's losers were slightly bigger than 1R (which is common when a high-win-rate trader holds losers hoping they come back), B goes negative fast.
Why high win rates hide danger
A trader with an 80 per cent win rate has a psychological problem waiting to happen. Being right most of the time trains the habit of not taking the stop, because usually price comes back. So the average loser creeps from 1R to 1.5R to 3R over time as the trader gives losers more room. Meanwhile the winners stay small because the trader banks them quickly to protect the win rate. The equity curve looks smooth and rising, then one held loser at 8R undoes two months of work. This is exactly how the grindy losing accounts tend to end.
Melati had a scalping strategy with a 76 per cent win rate and was proud of it. Her account was flat over six months. When she logged her trades in R terms she saw the problem: her winners averaged 0.6R and her losers averaged 1.4R because she kept moving stops. She switched to letting trades run to a 2R target and taking the stop every time. Her win rate dropped to 51 per cent and her account started growing for the first time. She said giving up the high win rate was the hardest change she ever made because it felt like getting worse at trading.
The formula
Expectancy per trade = (win rate x average win) minus (loss rate x average loss). If that number is positive, the strategy makes money over enough trades. Some examples, all with a 1R average loss:
- 35% win rate, 3R average win: expectancy = 0.35 x 3 - 0.65 x 1 = +0.40R per trade. Strongly profitable.
- 50% win rate, 1.5R average win: expectancy = 0.50 x 1.5 - 0.50 x 1 = +0.25R per trade. Profitable.
- 60% win rate, 0.7R average win: expectancy = 0.60 x 0.7 - 0.40 x 1 = +0.02R per trade. Barely positive, spread and swap probably make it negative.
- 80% win rate, 0.5R average win: expectancy = 0.80 x 0.5 - 0.20 x 1 = +0.20R per trade. Profitable, but fragile if losers grow.
What to aim for
A durable retail strategy usually has a win rate somewhere between 40 and 55 per cent and an average winner between 1.5 and 3 times the average loser. That combination is robust: it does not depend on being right most of the time, and it does not fall apart if a losing streak runs long. Aim for it by setting targets at 1.5R to 2R minimum, taking every stop, and being willing to be wrong more than half the time.
Log every trade as an R multiple in a spreadsheet: +2R, -1R, -1R, +1.8R. After 50 trades, average your winners and your losers separately. If winners average below 1.3R or losers average above 1.1R, that is where your strategy is leaking, not the win rate.
Adjusting expectancy for spread and swap costs
Every expectancy calculation above treats R as if entries and exits were free. They are not. Every trade pays the spread on entry, and any position held past rollover pays or earns swap on top of that. Both have to be converted into R terms and subtracted before an expectancy number can be trusted, because a strategy that looks marginally profitable on paper can be genuinely negative once its real transaction costs are included.
Converting spread into R is straightforward: if your stop distance is 20 pips, that is your 1R. A 1.5-pip round-trip spread is 1.5 divided by 20, or 0.075R, paid on every single trade regardless of outcome. Go back to the '60% win rate, 0.7R average win' example further up: its raw expectancy was +0.02R per trade, and a 0.075R spread cost alone erases that and pushes the strategy negative before swap is even added. That is exactly the case the formula flagged as fragile, and this is the arithmetic behind why.
Swap adds a further, ongoing cost for any position held past the broker's daily rollover, on top of the spread, and it scales with how many nights the trade stays open rather than being a one-off charge. A strategy with a thin raw edge and a habit of holding for several nights on a carry-costly pair needs to check that cost specifically, not assume it is small. The overnight swap guide has the actual per-pair figures to run through this the same way.
Frequently asked
What does 1:2 risk-reward mean?
You risk 1 unit to make 2. If your stop is 20 pips away, your target is 40 pips away. A 1:2 trade only needs to win about 34% of the time to break even.
Can a 30% win rate really be profitable?
Yes, if the average winner is large enough. At 30% win rate and a 3R average winner with a 1R loser, expectancy is +0.20R per trade, which compounds well over hundreds of trades. Trend-following strategies often work this way.
Why do beginners chase high win rates?
Because being right feels good and losses feel like failure. High-win-rate strategies deliver that feeling, but they train the habit of not taking stops, which eventually produces one catastrophic held loser.
What is expectancy?
The average profit or loss per trade, expressed in R (risk units). Expectancy = (win rate x avg win) - (loss rate x avg loss). Positive expectancy plus enough trades plus proper sizing equals a growing account.
How many trades do I need before my win rate and R stats mean anything?
At least 50, ideally 100-plus. Small samples are dominated by luck. A 5-trade winning streak tells you nothing about your edge.
Related reading
The team behind this guide
Researched, checked and approved by five forex specialists
Every guide is written, fact-checked and edited before it goes live, and updated when the facts change. Spotted an error? Tell us.