

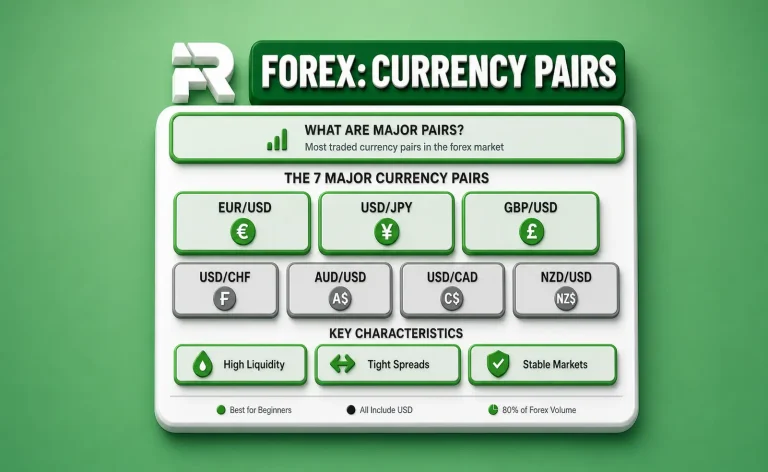
 EUR/USD
  GBP/USD
  USD/ZAR
  EUR/INR
  EUR/GBP
  XAU/USD (Gold)
  XAG/USD (Silver)
  XM Global
  AvaTrade
  RoboForex
  IC Markets
  LiteFinance
  IUX Markets
  FP Markets
  South Africa
  Thailand
  Singapore
  Japan
Japan  Pakistan
  Malaysia
  Philippines
  Brazil
  Bangladesh
  Vietnam
  India
India 
ADX Indicator: Measuring Trend Strength
The ADX indicator tells you how strong a trend is, not which way it’s going. It runs on a scale, and the higher the reading, the stronger the move, whether price is climbing or falling. A low ADX usually means the market is drifting sideways with no real direction, which is a warning that trend strategies may struggle. Traders use it to decide when to trust a trend and when to sit on their hands, so it pairs well with tools that show direction rather than working alone.




The ADX (Average Directional Index) is a single line on your chart, scored 0 to 100, that tells you how strong a trend is, not which way it is going.
A reading above 25 points to a real trend worth trading with. A reading below 20 says the market is drifting sideways, and trend strategies tend to get chopped to pieces there. That one filter, trend or no trend, is what makes the tool worth learning.
Here is the catch most beginners trip over: a rising ADX does not mean price is going up. It only means the current move, up or down, is gaining steam. Direction comes from somewhere else, either the two helper lines that ship with it or your own read of price. Get that one idea straight and the rest falls into place.
Skip the fancy strategies for now. The most useful thing ADX does is stop you from trading a trend that was never there.
Where ADX Indicator Came From, and What It Measures
J. Welles Wilder Jr. built the ADX in 1978, alongside the RSI and a few other tools traders still use daily. It sits in a small window below your price chart and plots as one line that rises and falls between 0 and 100.
The higher that line climbs, the stronger the trend, full stop. It does not care whether price is rocketing up or falling off a cliff. A market crashing hard can print the same high ADX as one ripping higher. Strength is the only thing it reports.
That sounds limiting, and it is the whole point. By stripping out direction, ADX answers one clean question: is this market actually trending, or just wandering? Answer that first and you already avoid a pile of bad trades.
Reading the Numbers
You do not need the math to use it. You do need to know roughly what the levels mean. These are common reference zones, not hard laws, so treat them as a guide.
| ADX reading | What it usually means |
| Below 20 | Weak trend or none at all. The market is likely drifting sideways. Trend trades get whipsawed here. |
| 20 to 25 | A grey zone. A trend may be forming, but it is not confirmed. Many traders wait. |
| 25 to 40 | A real, healthy trend worth trading in the direction price is already going. |
| 40 to 50 | A strong trend. Momentum is firmly behind the move. |
| Above 50 | Very strong, and often stretched. In liquid pairs you rarely see this hold for long. |
The +DI and -DI Lines
ADX often comes with two extra lines, the +DI and the -DI. This is where direction sneaks back in. The ADX line itself stays silent on which way, but these two do not.
- When +DI sits above -DI, buyers are in control. The bias is up.
- When -DI sits above +DI, sellers are winning. The bias is down.
Some traders act on the crossovers, buying when +DI crosses above -DI and selling on the opposite. On their own those crosses are noisy and fire often in flat markets. Pairing them with an ADX above 25 filters out most of the junk. A cross while ADX is flat and below 20 is usually a trap.
Not everyone uses the DI lines at all. Many keep it simple: ADX for strength, price or a moving average for direction. Both approaches are fine.
How Traders Use It
The single most powerful use is as a regime filter. Before you pick a strategy, ask what kind of market you are in.
ADX above 25 and rising: the market is trending. Trend-following setups, breakouts, and moving-average pullbacks have a fair shot. Momentum tools like RSI can sit at extremes for a long time here, so do not fade the trend just because RSI looks overbought.
ADX below 20: the market is ranging. Trend trades will get whipsawed. This is where range and mean-reversion setups, buying support and selling resistance, tend to work better.
Used this way, ADX does not hand you entries. It tells you which playbook fits the moment. That alone lifts a lot of traders out of the habit of forcing trend trades in dead markets.
A second common use is as a breakout check. A break above resistance with ADX rising through 25 has more behind it than one where ADX is flat and low. The flat-ADX breakout is the classic fakeout.
A Worked Example
Say you are eyeing EUR/USD and price just broke above a level it had been stuck under for days.
You glance at ADX. It is sitting at 14 and going nowhere. That flat, low reading is a warning: the breakout has no strength behind it, and the odds favour a snap back into the range. You pass.
A week later, price breaks the same level again. This time ADX is at 27 and climbing, with +DI pulling clearly above -DI. Now the picture agrees with itself: a real trend, moving up, with momentum building. That is the setup worth taking, with a stop below the breakout level.
[Screenshot suggestion: two EUR/USD charts side by side, one showing a failed breakout with flat ADX under 20, the other a clean breakout with ADX rising through 25 and +DI over -DI. A first-hand line about a fakeout you personally avoided this way would add real trust.]
The Best Settings
The default is 14 periods, and most traders never change it. Wilder built it around 14 and it holds up well across forex pairs and timeframes.
A shorter setting, say 7 to 10, reacts faster but fires more false signals. A longer one, 20 to 30, is smoother and slower. If you are new, leave it at 14 and spend your energy on reading the slope and the levels instead. Tinkering with the period is a distraction until the basics feel automatic.
What ADX Cannot Do for You
Worth saying straight. ADX is a strength meter, not a signal machine, and it has clear blind spots.
- It lags. It smooths past price, so it confirms a trend after it has begun rather than calling the exact turn. You catch the middle of the move, not the bottom.
- It says nothing about direction on its own. Read a rising ADX as “price is going up” and it will burn you.
- It whipsaws around 20 to 25 when the market is switching between trending and ranging, giving mixed readings. Waiting for a clear break past 25 helps.
- It can wobble during big news releases, when price gaps and spikes distort the calculation.
None of that makes it weak. It makes it a filter, best used next to price action and a directional tool, never alone. And no ADX reading, even 50, removes the need for a stop and sensible risk.
A Simple Way to Start
Add ADX with the 14 setting and leave it there. For a week, do not trade off it. Just watch. Note what price does when the line is below 20 versus above 25, and see how often a low, flat reading lines up with a market going nowhere.
Once that clicks, use it as a gate. Only take trend trades when ADX is above 25 and rising. Let the rest go. At FX Recap, the traders who get value from ADX treat it as a filter that keeps them out of bad markets, not a crystal ball that picks winners. The edge is in the trades you skip.

FX Recap helps you find a trusted forex broker that keeps your trades secure and guides you through everything you need to know about FX instruments.

Ranjan Niskrity is a seasoned Crypto and Forex expert at FX Recap with over a decade of market experience. He specialises in verifying broker data, regulatory frameworks, and cryptocurrency trading insights. His rigorous fact-checking ensures every article meets the highest standards of accuracy.
Related Articles

 Education
22 min read
Education
22 min read
