 South Africa
  Thailand
  Singapore
  Japan
Japan  Pakistan
  Malaysia
  Philippines
  Brazil
  Bangladesh
  Vietnam
  India
India 


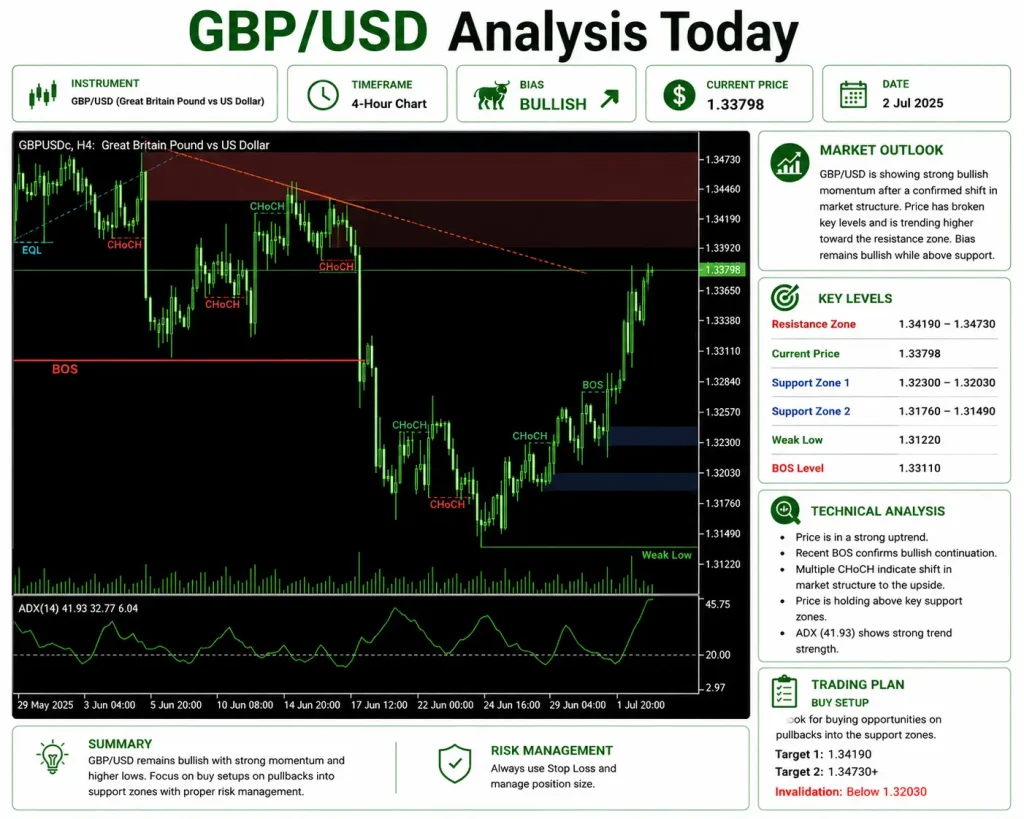
GBP/USD Analysis Today: Sterling Rallies on Sharp Dollar Sell-Off
GBP/USD Analysis Today: The British Pound surges toward 1.3360 as soft US jobs data fuels expectations of a less aggressive Federal Reserve, sending the dollar lower.


The major currency markets are moving fast today as a soft US employment report reshapes the near-term path for interest rates. In today’s GBP/USD analysis, we look at the Pound’s strong recovery from its recent lows. Fueled by a broad sell-off in the greenback, Cable has climbed comfortably back above the 1.3300 handle and is trading near 1.3363. Below, we break down the 4-hour chart to identify realistic entries and targets for the sessions ahead.
Market Overview
GBP/USD spent the first half of June in a steep decline, and macro sentiment turned decidedly bearish along the way. That downward momentum broke today. The US Dollar Index (DXY), which had been dominating the majors, dropped sharply as traders trimmed their long positions. The sudden dollar weakness gave the Pound room to carve out a solid intermediate bottom, and short-term control has shifted back to the buyers.
Fundamental Analysis
The catalyst behind the Pound’s rally is the weaker-than-expected US Non-Farm Payrolls report for June. The US economy added just 57,000 jobs, falling far short of the consensus of roughly 110,000 to 113,000. Making matters worse, downward revisions to April and May erased another 74,000 jobs from prior totals. The cooling trend in the US economy is now hard to argue with.
Rate markets responded immediately. The probability of near-term Fed rate hikes dropped to 52%, down from over 64% earlier in the week.
That repricing pulled US 10-year Treasury yields off their recent highs, removing a crucial pillar of dollar strength. With the dollar’s rate advantage shrinking relative to the Bank of England’s current stance, institutional capital is rotating out of crowded greenback positions and back into majors like the Pound.
Technical Analysis
The 4-hour chart shows a complete shift in short-term structure, with buyers successfully dismantling a mature bearish trend.
Trend and Market Structure
The market spent several weeks in a heavily bearish phase, marked by multiple downward Changes of Character (CHoCH) and a major horizontal Break of Structure (BOS) line at 1.3305. That selling pressure eventually exhausted itself at a structural floor around 1.3135, marked on the chart as a Weak Low.
After defending that low, buyers stepped in heavily. The market built a base, printed a bullish CHoCH around 1.3250, and followed it with a series of higher lows. The most recent leg of the expansion smashed straight through the old horizontal BOS resistance at 1.3305, turning a major historical ceiling into an active floor.
Price Action and Momentum
The move into the current 1.33637 level has been vertical and momentum-driven, with barely any intraday pullback. Buyers own this timeframe right now and are systematically clearing out the previous liquidity pockets.
The 14-period ADX on the H4 chart prints a high reading of 40.76. Anything above 40 confirms a very strong trending environment. With the ADX line rising alongside the price spike, the bullish momentum appears backed by real institutional volume, which makes an immediate deep reversal unlikely before some consolidation first.
Trading Signal
With a confirmed bullish breakout on the 4-hour chart and a fundamentally weak dollar behind it, buying the first clean pullback offers a high-probability, risk-defined setup.
Market Bias: Bullish (Short-Term) / Neutral (Macro)
Entry Zone: 1.3285 – 1.3315 (buying the retest of the broken horizontal structural zone and old BOS line)
Stop Loss: 1.3230 (safely below the most recent higher low and demand block)
Take Profit 1: 1.3415 (the underside of the major upper consolidation zone)
Take Profit 2: 1.3460 (the major swing high resistance shelf)
Risk Reward Ratio: 1:1.50 (to TP1) / 1:2.35 (to TP2)
Confidence Level: Medium to High
Suggested Holding Period: 1–3 days
Setup Rationale
This setup aims to catch the continuation of the post-NFP momentum. Chasing the market at the top of a vertical move is poor risk-to-reward. Waiting for a pullback to the broken 1.3305 level lets traders enter long where past sellers are forced to cover, keeping the stop tight and well-protected.
Invalidation Conditions
A 4-hour candle close below 1.3230 kills this setup completely. It would mean the breakout above 1.3305 was a bull trap, handing control back to macro sellers and exposing the market to a retest of the 1.3135 Weak Low.
Bullish Scenario
To keep driving this market, buyers must hold price above the 1.3305 pivot zone on subsequent pullbacks. The immediate objective is to clear the local overhead liquidity and push toward 1.3415. A clean close above 1.3415 opens the door to the primary structural resistance shelf at 1.3460. Success there would effectively erase the entire June decline and signal a broader macro reversal back toward the yearly highs above 1.3500.
Bearish Scenario
To regain their footing, sellers need to halt this advance quickly, below the 1.3400 psychological level. Bears must force an aggressive reversal back under the 1.3305 breakout line. A sustained close below 1.3285 would show the breakout lacked genuine follow-through, likely shifting momentum back down toward the intermediate support shelves at 1.3230 and 1.3200, and ultimately the Weak Low at 1.3135.
Key Price Levels
| Level | Price | Importance |
|---|---|---|
| Resistance 2 | 1.34600 | Major historical swing high and long-term distribution zone |
| Resistance 1 | 1.34150 | Upper structural shelf and prior consolidation support |
| Pivot | 1.33050 | Major horizontal Break of Structure line; key trend inflection area |
| Support 1 | 1.32300 | Key H4 higher low protecting the recent bullish breakout sequence |
| Support 2 | 1.31350 | Recent Weak Low print providing ultimate structural support |
What Traders Should Watch Today
US ISM Services PMI: Landing right after the disappointing labor data, this print gives the market a final read on US economic health for the week. A weak number would likely extend the dollar sell-off.
US 10-year Treasury yields: Watch whether the 10-year breaks below its local support floors. A continued drop in yields gives GBP/USD more fuel to extend the run.
The H4 closes around 1.3305: This is the level that decides everything short-term. Consistent candle closes well above it show buyers are firmly defending the breakout zone.
Conclusion
The pair took heavy selling all month, but a weak US jobs report has given buyers the fuel for a genuine trend reversal on the 4-hour chart. The clean break above the 1.3305 structural resistance, backed by a strong ADX reading of 40.76, points the short-term path upward. Managing risk around the 1.3305 pivot will be the key to navigating the next leg of this move.
Disclaimer: This analysis is provided for educational purposes only and should not be considered investment advice.
FX Recap helps you find a trusted forex broker that keeps your trades secure and guides you through everything you need to know about FX instruments.

Ranjan Niskrity is a seasoned Crypto and Forex expert at FX Recap with over a decade of market experience. He specialises in verifying broker data, regulatory frameworks, and cryptocurrency trading insights. His rigorous fact-checking ensures every article meets the highest standards of accuracy.
Related Articles
 Technical Analysis
7 min read
Technical Analysis
7 min read
 Technical Analysis
6 min read
Technical Analysis
6 min read