
 XM Global
  AvaTrade
  RoboForex
  IC Markets
  LiteFinance
  IUX Markets
  FP Markets
  South Africa
  Thailand
  Singapore
  Japan
Japan  Pakistan
  Malaysia
  Philippines
  Brazil
  Bangladesh
  Vietnam
  India
India Analysis
Learning Forex Charts: The Art of Smarter Trading by Interpretation

 EUR/USD
 GBP/USD
 USD/ZAR
 EUR/INR
 EUR/GBP
 XAU/USD (Gold)
 XAG/USD (Silver)
 Forex indicators turn raw price data into readable signals that help traders spot trends, measure momentum, and time entries with more confidence. This article breaks down the four main indicator categories, explains how the most widely used tools actually work, and shows how to combine them without cluttering your charts. You will also find honest guidance on where indicators fall short and how to use them as part of a complete trading approach.




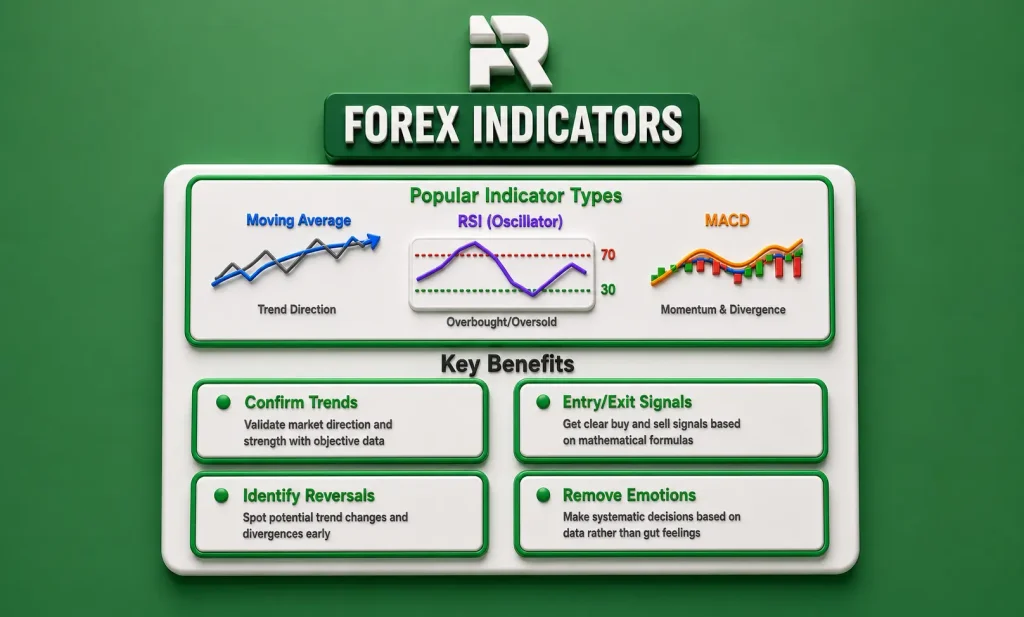
Forex indicators are mathematical calculations applied to price data that translate raw market movement into visual signals. They take the highs, lows, opens, closes, and volume of every candle and convert them into lines, bands, or histograms that reveal patterns not always obvious from the chart alone.
They are not crystal balls. They do not predict the future. What they do is describe what has been happening with enough clarity that a trader can form a reasonable view of what is likely to develop next.
A moving average shows whether price is trending up or down over a chosen period. RSI reveals whether a market is being bought or sold aggressively enough to suggest exhaustion. Bollinger Bands highlight when volatility has compressed to a point where a breakout becomes probable. Each indicator answers a specific question about market behavior, and when several answers line up, the picture becomes clearer.
This article covers how forex indicators work, the main categories you need to know, how to apply them without overcomplicating your charts, and where they fall short. If you are new to reading charts entirely, FXRecap’s guide on learning forex charts is a good starting point before going deeper into indicators.
Algorithmic trading now accounts for a large share of daily forex volume. Price action trading is widely discussed as a cleaner, purer approach. Some traders argue indicators are redundant. That argument misses something important.
Markets move in cycles of momentum, fear, and volatility. Those cycles existed before any modern software and they continue today because they are driven by human and institutional behavior that repeats across time. Indicators are built to detect those cycles and make them readable.
A simple moving average cuts through noise and reveals the actual direction of a trend. RSI flags momentum exhaustion before a reversal materializes on the candlestick chart. ATR tells you whether the market is in a quiet consolidation or approaching a high-volatility breakout. None of these require prediction. They require observation of what is already happening.
Most algorithmic and automated trading systems are built on the same mathematical foundations as classic indicators. The formulas did not become obsolete. They became the engine inside more sophisticated tools. Indicators used by a skilled trader still serve the same function they always did: they remove emotional bias and bring structure to what would otherwise look like random movement.
My first forex chart was a disaster. MACD, RSI, stochastic oscillator, Bollinger Bands, three moving averages, and Ichimoku clouds all stacked on top of each other. Every indicator pointed in a different direction. Three said sell, one said buy, and the rest were inconclusive.
One evening I entered a USD/CAD trade because RSI showed oversold. I did not bother looking at the broader structure because my screen was too crowded to read anything clearly. Price dropped another 60 pips. The loss grew faster than I could process what had gone wrong.
The lesson that came out of that trade was not about RSI being wrong. It was about indicator overload. When you pile too many tools onto a chart, they do not add information. They create confusion. Each one contradicts another, and instead of gaining clarity, you end up justifying whatever bias you already had.
After removing roughly 80% of the indicators and keeping only three with complementary functions, the charts became readable again. Decisions became cleaner. The indicators started confirming each other rather than arguing. That is when they became genuinely useful.
Every indicator is derived from past price data. This is worth stating plainly because it defines both their value and their limits. They do not forecast the future. They organize the past in a way that reveals structure.
The different types measure different things. Moving averages calculate the average price over a set number of periods, smoothing out short-term fluctuations to reveal the underlying direction. RSI measures the speed and size of recent price moves to determine whether buyers or sellers have been dominant. MACD tracks the relationship between two moving averages to identify changes in momentum. ATR calculates the average range of recent candles to quantify how much the market has been moving.
Each indicator speaks a different language about the same market. A candle that jumps 70 pips in one session may look dramatic on its own. ATR will tell you whether that move is unusual or completely normal given recent volatility. A moving average crossover may appear to signal a trend change, but MACD can tell you whether the momentum behind that crossover is strong or fading before the move develops further.
Traders who understand what each indicator is actually measuring, rather than just what signals it produces, develop a much better instinct for when to trust a signal and when to wait for more confirmation.
Forex indicators fall into four broad categories. Each category answers a different question about the market. Knowing the category before you select an indicator prevents the common mistake of stacking multiple tools that all answer the same question.
Trend indicators smooth price data to show the general direction of the market. They are most reliable during trending conditions and less useful when the market is ranging sideways. Moving averages are the most widely used: the 20, 50, and 200 period moving averages are standard reference points across most asset classes. The direction of the moving average, and whether price is trading above or below it, gives a fast read on trend bias.
Momentum indicators measure the speed of price change rather than the direction. RSI, MACD, and the Stochastic Oscillator belong in this category. They are particularly useful for spotting divergence, where price makes a new high or low but the indicator fails to confirm it. Divergence often precedes reversals and is one of the more reliable signals these tools generate.
Volatility indicators tell you how much the market has been moving, not which direction. ATR and Bollinger Bands are the most common. ATR is particularly useful for setting stop-loss distances because it reflects real market conditions rather than a fixed pip number. Bollinger Bands squeeze during low volatility periods and expand when volatility returns, which often coincides with significant price moves.
Volume indicators show the intensity of participation behind a price move. In forex, true volume data is not available because the market is decentralized, so tick volume is used as a proxy. It counts the number of price changes in a given period rather than the actual number of units traded. On Balance Volume and the Volume Oscillator are examples. A price breakout accompanied by a surge in tick volume carries more weight than one occurring during thin conditions.
A moving average calculates the average closing price over a defined number of periods and plots it as a line on the chart. The simple moving average treats all periods equally. The exponential moving average gives more weight to recent data, making it more responsive to current price action.
Common uses include identifying trend direction, finding dynamic support and resistance levels, and generating crossover signals. When the 50-period MA crosses above the 200-period MA, it is referred to as a golden cross and is widely watched as a bullish signal. The reverse, called a death cross, is interpreted as bearish. These signals are most meaningful when combined with other confirmation.
RSI measures the magnitude of recent price gains against recent losses and outputs a value between 0 and 100. Readings above 70 suggest overbought conditions. Readings below 30 suggest oversold. These thresholds are not automatic reversal signals. A market can stay overbought for extended periods during a strong trend.
Where RSI becomes most useful is in spotting divergence. If price is making higher highs but RSI is making lower highs, the momentum behind the move is weakening. That disconnect often precedes a correction or reversal, giving traders an early warning before the chart confirms it.
MACD tracks the difference between a 12-period and 26-period exponential moving average, then plots a 9-period signal line on top. When the MACD line crosses above the signal line, it suggests building bullish momentum. When it crosses below, bearish momentum is gaining.
The histogram below the lines shows the distance between MACD and the signal line. A shrinking histogram during a trend can warn that momentum is fading before a crossover occurs, giving traders earlier notice than waiting for the line cross itself.
Bollinger Bands consist of a 20-period moving average with two bands plotted two standard deviations above and below it. When the bands contract, volatility is low and the market is consolidating. When they expand, volatility is rising. Traders watch for a squeeze, the period of narrow bands, as a precursor to a significant directional move.
Price touching the outer band does not automatically mean a reversal is due. In strong trends, price can walk along the outer band for extended periods. The value of Bollinger Bands lies more in identifying the state of volatility than in predicting specific price levels.
ATR calculates the average range of recent candles, including gaps, to give a measure of current market volatility. It does not point up or down. It simply tells you how much the market has been moving per period on average.
The practical application is in stop-loss placement. Rather than using a fixed 20-pip stop on every trade, a trader using ATR sets the stop at a multiple of the current ATR value. If ATR on EUR/USD is 60 pips, a stop at 1.5x ATR is 90 pips, reflecting actual market conditions. This approach prevents being stopped out by normal volatility while keeping risk proportionate.
The Stochastic Oscillator compares a closing price to its price range over a set number of periods. Like RSI, it oscillates between 0 and 100, with readings above 80 considered overbought and below 20 considered oversold. It tends to generate signals faster than RSI, which makes it more reactive but also more prone to false signals in trending markets.
It works best in ranging conditions where price is bouncing between defined levels rather than trending strongly in one direction.
This distinction matters practically because it affects how you use each tool and what you expect from it.
Lagging indicators are based on price history and confirm what has already happened. Moving averages and MACD are lagging by nature. They are excellent for confirming a trend is in place and filtering out false signals, but they will always enter a move late. By the time a moving average crossover occurs, a significant portion of the move has already happened.
Leading indicators attempt to signal what might happen next. RSI and the Stochastic Oscillator are designed to anticipate reversals by detecting extreme conditions before price confirms them. The trade-off is that leading indicators generate more false signals. A market can stay overbought or oversold for far longer than the indicator suggests is reasonable.
Professional traders typically use a combination of both. A lagging indicator to confirm the trend direction and a leading indicator to time entries within that trend. This way the trend filter reduces the number of false signals from the timing tool.
The temptation when starting out is to add indicators until the chart looks authoritative. The result is the opposite. Too many indicators produce conflicting signals, slow down analysis, and create the illusion of certainty where none exists.
The approach that works is to select two or three indicators that cover different categories: one for trend direction, one for momentum, and optionally one for volatility. Each tool should answer a different question so that together they form a complete picture rather than three versions of the same view.
An example setup: a 50-period EMA to identify trend direction, RSI to assess momentum strength and look for divergence, and ATR to calibrate stop-loss distances based on current volatility. These three tools do not overlap. The EMA answers which direction, RSI answers how strong, and ATR answers how much room to give the trade.
Once the chart is simplified, market structure becomes visible again. Support and resistance levels are easier to identify. Candlestick behavior at key levels starts to make sense.
If you have not yet explored how candlestick patterns relate to indicator signals, FXRecap’s guide on candlestick charts in forex is worth reading alongside this one.
Confluence means multiple independent signals pointing to the same conclusion at the same time. It is the standard method professional traders use to increase the probability of any individual setup.
A single indicator signal in isolation carries limited weight. RSI showing oversold on a 1-hour chart does not tell you much. But RSI showing oversold at a major support level that also coincides with a 200-period moving average and a bullish candlestick pattern, that is a different situation entirely. Every element of that setup is pointing in the same direction independently.
The practical process works like this. Start with the higher timeframe to establish trend direction and key structural levels. Then drop to the trading timeframe to look for indicator signals that align with that structure. An entry signal that agrees with the higher timeframe trend, sits at a structural level, and is confirmed by both a trend and momentum indicator carries significantly more weight than any single signal in isolation.
Confluence is not about adding more indicators. It is about having different types of evidence agree. Price structure, trend direction, and momentum reading can all align without needing six indicators. Three tools providing three types of confirmation is more valuable than ten tools all measuring momentum.
FXRecap covers specific entry techniques and how indicator confluence fits into a complete trading approach in the forex trading strategies guide.
No indicator can prevent losses. No indicator sees what is about to happen. They are retrospective tools built on historical data, which means they are always responding to what has occurred rather than what is about to occur.
When unexpected news hits the market, an effective trend indicator becomes irrelevant in an instant. A central bank making an unscheduled rate announcement can reverse a technically perfect setup in seconds. A liquidity gap before a major economic release can send price through a stop-loss before any indicator has a chance to adapt.
Indicators also fail during ranging markets if you are using trend-following tools without recognizing the market context. A moving average crossover strategy applied to a market that is oscillating between the same support and resistance for three weeks will generate a long series of losing trades regardless of how well the indicator is configured.
The discipline that protects you when indicators fail is risk management. Defined stop-losses, appropriate position sizing, and awareness of the economic calendar are what keep losses survivable. Indicators can guide entry and exit decisions, but they cannot substitute for a risk framework.
FXRecap’s guide on forex risk management covers the risk side of trading in full, including how to size positions and set stop-loss levels that account for current market conditions.
Technical analyst John J. Murphy, whose work remains a standard reference in the field, described indicators as tools for smoothing out market noise to reveal the underlying trend even when prices appear chaotic. That observation captures their core function accurately.
The mistake many traders make is treating indicator signals as trade instructions rather than as context. An oversold RSI reading does not mean buy now. It means the recent selling pressure has been intense and a relief move may be approaching. That is context, not a command. Whether to act on that context depends on what the rest of the chart is telling you.
Indicators become genuinely powerful when they are used to confirm what you are already seeing rather than to replace the analysis of price structure. A divergence signal that appears at a key support level where the trend has been bullish carries weight. The same divergence signal appearing mid-trend in the absence of any structural significance carries much less.
Indicator technology is advancing in step with computing power and data availability. Several developments are already beginning to appear in retail trading platforms and are likely to become standard over the next several years.
Adaptive indicators are gaining ground. Rather than using fixed period settings, adaptive indicators adjust their sensitivity automatically based on current volatility. This makes them more responsive during active markets and less prone to false signals during quiet periods.
AI-assisted pattern recognition is increasingly being applied to indicator data. Instead of a trader manually reviewing RSI divergence across multiple timeframes, machine learning systems can scan for confluence patterns across thousands of instruments simultaneously and flag setups that match historically significant conditions.
Sentiment integration is another area developing quickly. Indicators that blend price data with positioning data from retail and institutional sources give traders a layer of information that pure price-based tools cannot provide.
What will not change is the underlying logic. Trend, momentum, volatility, and volume are the four things any useful indicator measures. The calculations will become more sophisticated but the questions they answer will remain the same. Traders who understand what those questions are, and why they matter, will be able to adapt to new tools as they emerge rather than starting from scratch.
Forex indicators are not shortcuts and they are not magic. They are tools built to organize past price data into readable information about trend, momentum, volatility, and participation. Used well, they reduce emotional bias, surface structure that is not visible on the raw chart, and add measurable confidence to trading decisions.
The most effective approach is to use two or three indicators from different categories, understand what each one actually measures, and require that multiple tools agree before acting on a signal. An oversold RSI at a major support level during a broader uptrend is a different situation from an oversold RSI in a featureless part of a downtrend. The indicator is the same. The context is what determines whether it means anything.
Indicators work alongside price analysis, sound risk management, and clear judgment. They do not replace any of those things. The traders who get the most from them are the ones who know exactly what each tool is telling them, and equally, what it is not.
FXRecap covers each of the major indicators in more depth across the education library, along with practical guides on stop-loss and take-profit, forex trading strategies, and getting started in forex as a beginner.

FX Recap helps you find a trusted forex broker that keeps your trades secure and guides you through everything you need to know about FX instruments.

Ranjan Niskrity is a seasoned Crypto and Forex expert at FX Recap with over a decade of market experience. He specialises in verifying broker data, regulatory frameworks, and cryptocurrency trading insights. His rigorous fact-checking ensures every article meets the highest standards of accuracy.
 Education
6 min read
Education
6 min read
 Education
22 min read
Education
22 min read Education
16 min read
Education
16 min read